Mms raman spectrometer features – Ocean Optics SpectraSuite User Manual
Page 88
6: Spectrometer Menu Functions
76
000-20000-300-02- 201110
Detector Image
–
Shown just below the False Color Spectrum frame is the detector image as seen before
in the Exposure Image tab that has been colorized as indicated by the False Color Spectrum.
Horizontal Variation Plot
NOTE
You must select a pixel in the detector array by clicking on the detector image to activate
the horizontal and vertical variation plots.
Horizontal Variation – Below the detector image is a plot of intensity across the current row number
given by the present location of the cursor. For example if the cursor is located at pixel in row 32 column
350, then this plot would show the variation in the pixels located in row 32. The scale of the plot is
between zero (minimum) and the saturation value of the detector (maximum).
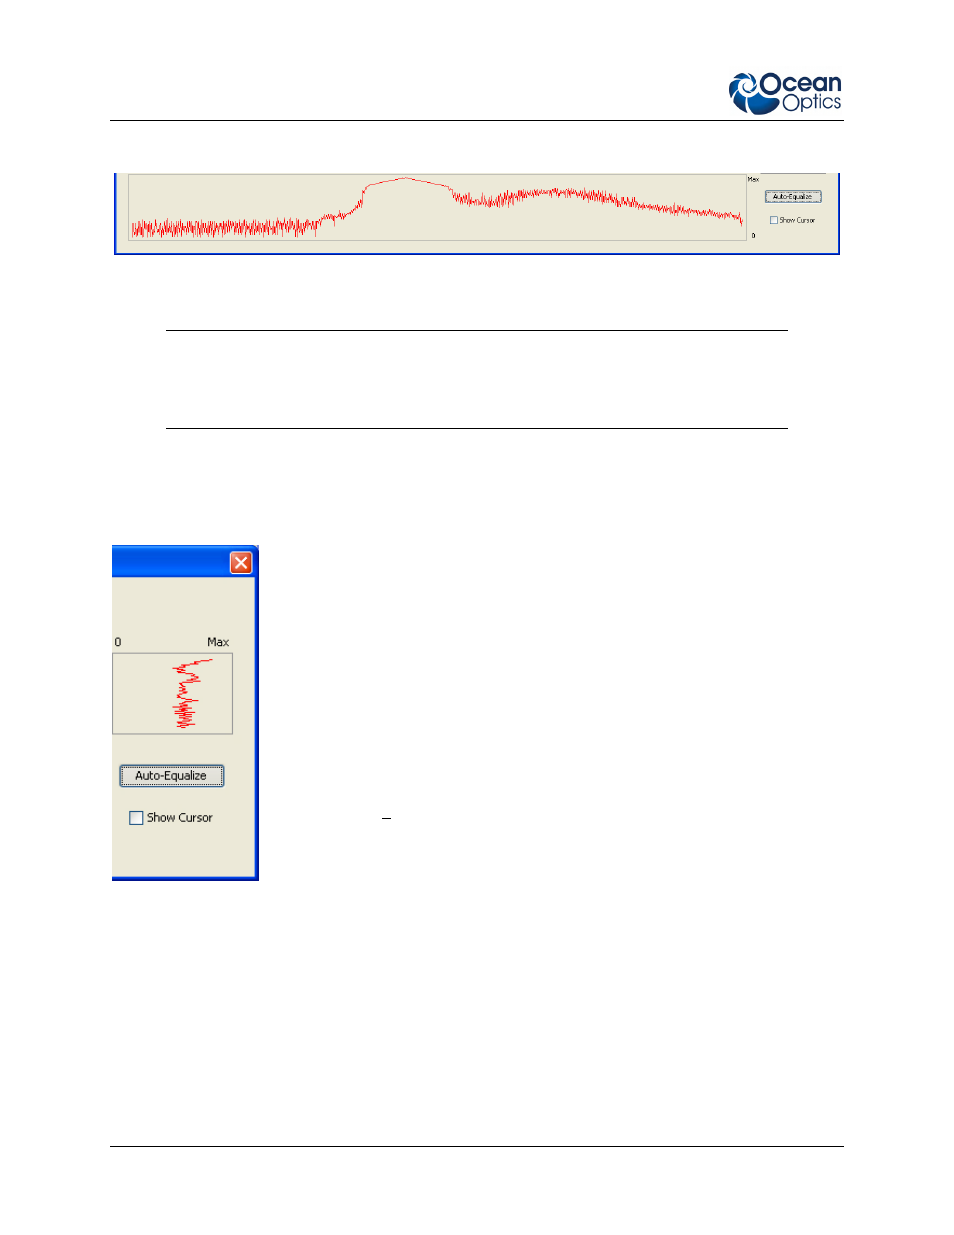
Vertical Variation
–
To the right of the detector image is a plot of intensity for
all the pixels in the current column, as indicated by the location of the cursor. For
example, if the cursor is located at row 32 and column 350, then this plot would
show the variation in the pixels located in column 350 on the detector. The scale
for this plot is between zero (minimum) and the saturation value of an individual
pixel (maximum).
Auto Equalize – This button performs exactly the same function on the
colorized detector image as it did on the grey-scale detector image on the
Exposure Image tab. See the Auto Equalize Enabled figure on the previous
page.
Show Cursor
–
Controls the visibility of crosshairs that display the current
location of the cursor, as seen on the detector image detector. By checking this
box, the cursor becomes visible. By unchecking this box, the cursor will
disappear when the user selects another location for the cursor is selected.
MMS Raman Spectrometer Features
The following are special features for the MMS Raman Spectrometer.
Vertical Variation Plot