Ocean Optics SpectraSuite User Manual
Page 155
A: Experiment Tutorials
000-20000-300-02- 201110
143
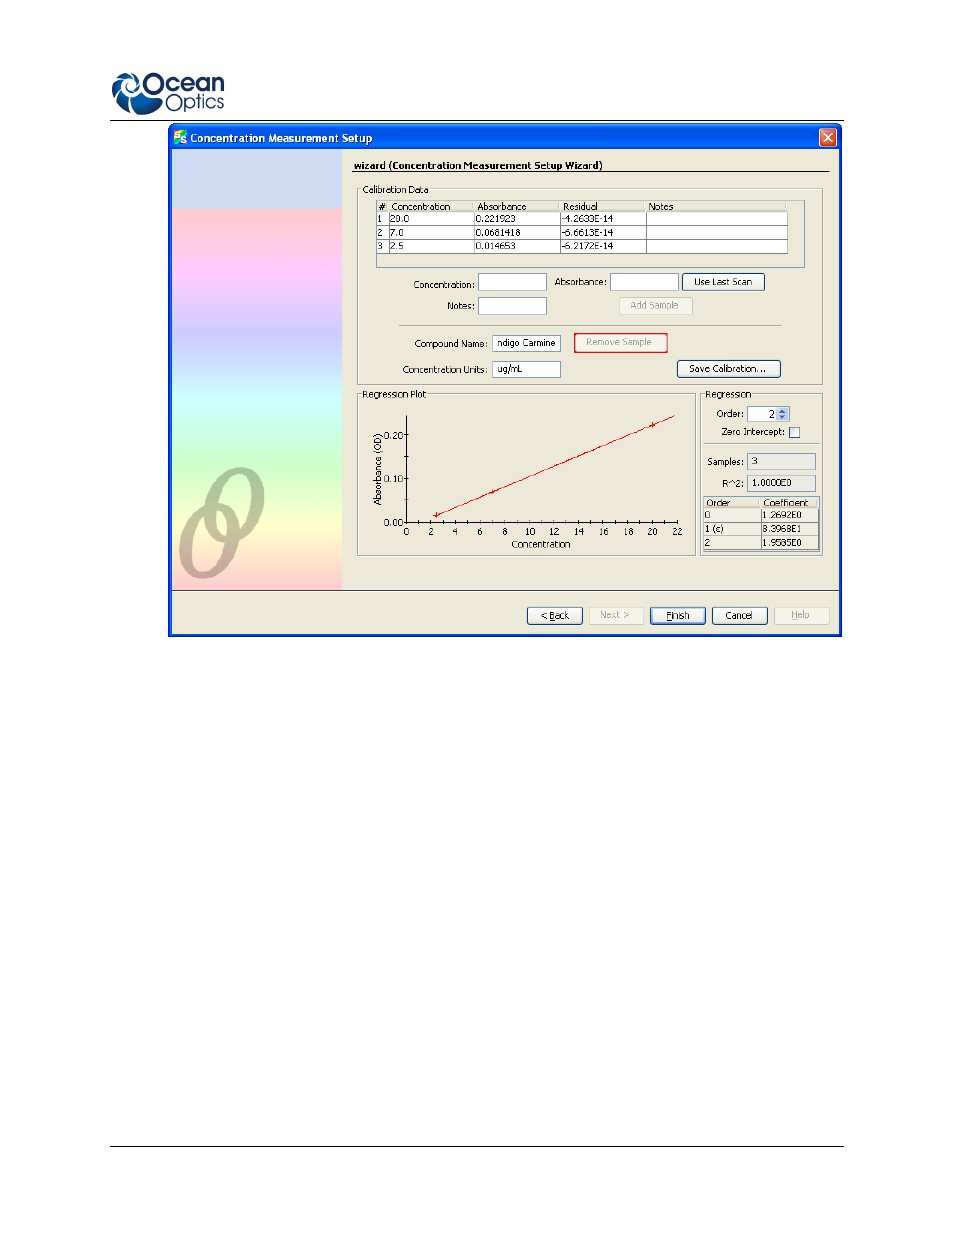
Enter options for how the regression is computed in the lower-right corner of the
window:
Order – Set the regression order to 1 (straight line fit) or 2 (second order polynomial fit).
Zero Intercept – You can force the regression line to pass through the origin (that is,
zero concentration and absorbance) by checking this box.
For a first order fit, at least two data points are necessary. For a second order fit, three
points are necessary. If Zero Intercept is selected, then only one point is required for a
first order fit and two points for a second order fit.
In general, more data points result in a better estimation of the concentration of an
unknown. It is recommended that as many calibration points be sampled in this way as is
practical. Also, allow your reference lamp to stabilize before attempting a calibration
with many points, as any drift in the lamp’s emission will introduce error into these
samples.
The quality of the regression is shown in the lower right as an R^2 value, where 1.0 is a
perfect fit (lower numbers indicate a poorer fit). The residual value for each point is also
shown in the table at the top of the window; this indicates the difference between the
known concentration for a sampled absorbance and the estimated concentration using the
regression. In the ideal case, this value will approach zero. Note that very small values
(on the order of 10-12 or smaller) are normal even for a good fit; this is due to a rounding
error and should have no discernable effect on solution quality.