Ocean Optics SpectraSuite User Manual
Page 53
4: File Menu Functions
000-20000-300-02- 201110
41
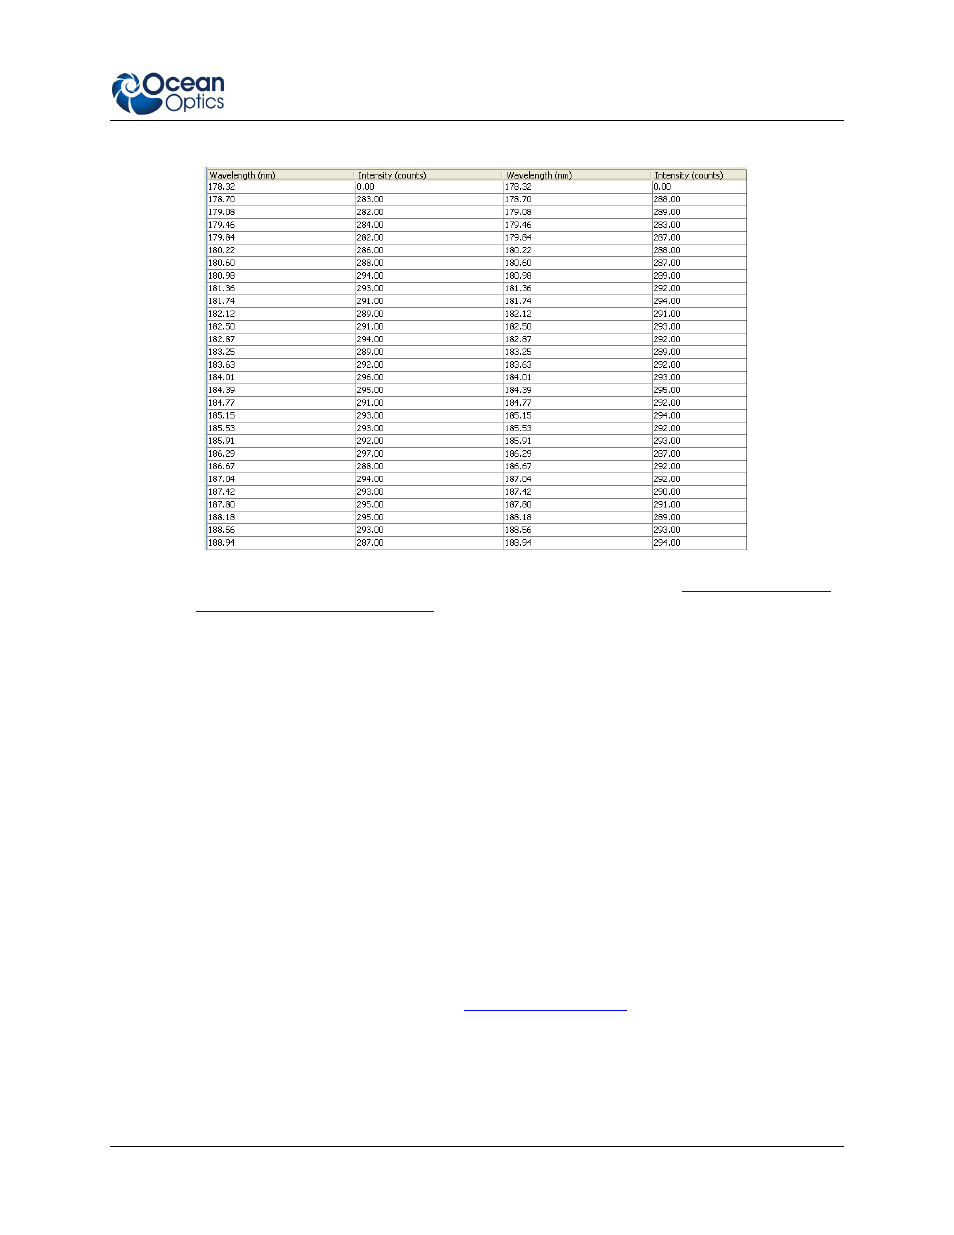
Spectrum Table – Displays spectra data in a table format
Save Spectra Collection – Stores the high-speed spectra in a file. See
of High-Speed Acquisition Spectra
for more information about what can be done with stored
high-speed spectra data.
3D Spectrum Terrain – Allows you to view intensity vs. wavelength over time in a 3-
dimensional format.
Export Grams SPC – Exports data in a file format (SPC) to load into GRAMS spectroscopy
software.
Remove Spectra – Deletes the captured high-speed spectra collection data. You can also
select Spectrometer | Remove Spectra.
Creating a 3-D Chart of High-Speed Acquisition Spectra
You can create a 3-dimensional representation of the data over time in graph form. The navigation
controls enable you to view the graph from different angles. Click on any point in the graph to display its
value and wavelength.
►
Procedure
To create a 3-D graph,
1. Start a high-speed data acquisition. See
for more information.
- Apex 785 Raman (1 page)
- STS-UV (2 pages)
- TR2 Engineering Note (4 pages)
- SAD500 Communications and Control (19 pages)
- Red Tide USB650 Install (26 pages)
- Fiber Optic Termination Kit (6 pages)
- Transmissive pH Probe (10 pages)
- Remora (42 pages)
- PlasCalc (59 pages)
- Correcting Device Driver Issues (8 pages)
- ecoVis Krypton Light Source (16 pages)
- LPC-500CM (28 pages)
- HPX-2000 (24 pages)
- ADC1000-USB (27 pages)
- Torus Operating Instructions (30 pages)
- ADC2000-PCI (13 pages)
- Sensors for Real-Time Analysis (2 pages)
- IDRaman reader (2 pages)
- DH-2000-CAL (30 pages)
- QE65 Pro (32 pages)
- Collimating Lenses (2 pages)
- D1000 (2 pages)
- IDRaman mini (2 pages)
- HR2000CG-UV-NIR (42 pages)
- Cool Red (1 page)
- HL-2000 (20 pages)
- XE-1 Xenon (6 pages)
- USB-ADP Serial Adapters (3 pages)
- CHEM2000 (36 pages)
- Deuterium-Halogen Calibration Light Source (19 pages)
- NeoFox Engineering Note (30 pages)
- QE Pro (2 pages)
- OOIBase32 (140 pages)
- AR-1 Argon (6 pages)
- pH Sensor Patches, Probes and Cuvettes (36 pages)
- SpecLine Offline Spectroscopy (60 pages)
- HL-2000-HP-232 (26 pages)
- External Triggering Options Instructions for Spectrometers with Firmware Version 3.0 and Above (16 pages)
- Breakout Box (10 pages)
- USB-ISS-UV_VIS (4 pages)
- ISS-UV_VIS (6 pages)
- OOIColor (14 pages)
- LS-1 Series (12 pages)
- Apex Install (24 pages)
- DH-2000 (34 pages)