Ocean Optics SpectraSuite User Manual
Page 105
7: Processing Menu Functions
000-20000-300-02- 201110
93
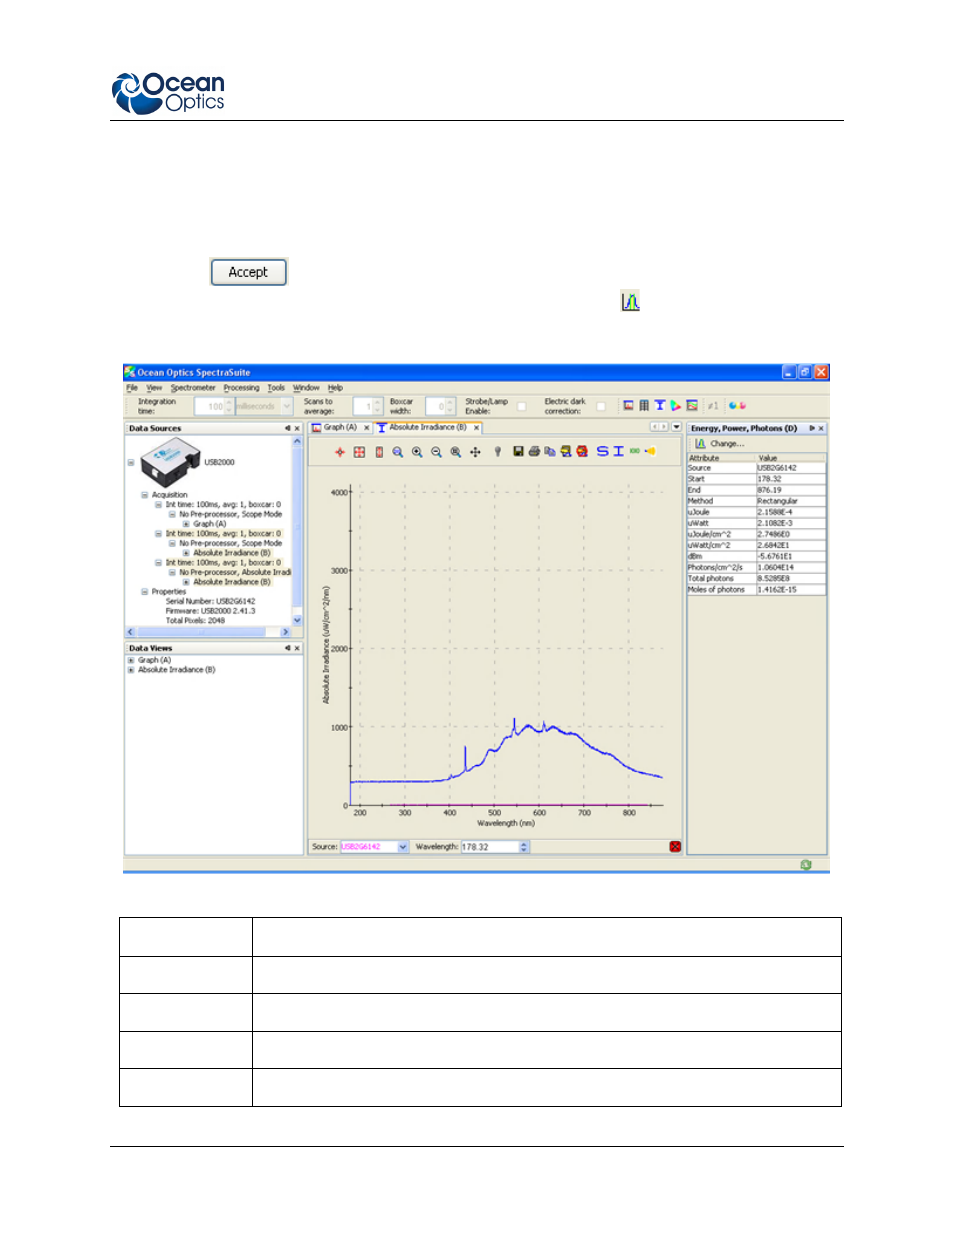
3. If more than one Absolute Irradiance graph is open, select the desired spectrometer by
highlighting it under Source.
4. Enter the wavelength range to integrate in the Integration Options section.
5. Enter the Integration Method, either Rectangular, Simpson’s (Rule), or Trapezoid.
6. Click
when finished. The Energy, Power, Photons table appears to the right of the
graph. You can change these values by clicking the Change icon (
) in the Energy, Power,
Photons table.
This table is described below:
Attribute
Meaning
Source
The absolute irradiance source you selected in Step 3.
Start
The starting wavelength you selected in Step 4.
End
The ending wavelength you selected in Step 4.
Method
The integration method you selected in Step 5.
- Apex 785 Raman (1 page)
- STS-UV (2 pages)
- TR2 Engineering Note (4 pages)
- SAD500 Communications and Control (19 pages)
- Red Tide USB650 Install (26 pages)
- Fiber Optic Termination Kit (6 pages)
- Transmissive pH Probe (10 pages)
- Remora (42 pages)
- PlasCalc (59 pages)
- Correcting Device Driver Issues (8 pages)
- ecoVis Krypton Light Source (16 pages)
- LPC-500CM (28 pages)
- HPX-2000 (24 pages)
- ADC1000-USB (27 pages)
- Torus Operating Instructions (30 pages)
- ADC2000-PCI (13 pages)
- Sensors for Real-Time Analysis (2 pages)
- IDRaman reader (2 pages)
- DH-2000-CAL (30 pages)
- QE65 Pro (32 pages)
- Collimating Lenses (2 pages)
- D1000 (2 pages)
- IDRaman mini (2 pages)
- HR2000CG-UV-NIR (42 pages)
- Cool Red (1 page)
- HL-2000 (20 pages)
- XE-1 Xenon (6 pages)
- USB-ADP Serial Adapters (3 pages)
- CHEM2000 (36 pages)
- Deuterium-Halogen Calibration Light Source (19 pages)
- NeoFox Engineering Note (30 pages)
- QE Pro (2 pages)
- OOIBase32 (140 pages)
- AR-1 Argon (6 pages)
- pH Sensor Patches, Probes and Cuvettes (36 pages)
- SpecLine Offline Spectroscopy (60 pages)
- HL-2000-HP-232 (26 pages)
- External Triggering Options Instructions for Spectrometers with Firmware Version 3.0 and Above (16 pages)
- Breakout Box (10 pages)
- USB-ISS-UV_VIS (4 pages)
- ISS-UV_VIS (6 pages)
- OOIColor (14 pages)
- LS-1 Series (12 pages)
- Apex Install (24 pages)
- DH-2000 (34 pages)