Spectrum graph – Ocean Optics SpectraSuite User Manual
Page 46
4: File Menu Functions
34
000-20000-300-02- 201110
Spectrum Graph
The Spectrum Graph menu option displays a new curve of spectral data on the open graph based on
the parameters set in the Acquisition toolbar. Each new curve you create appears as a different color in
the graph. Graphs appear in scope mode by default.
If you click on a curve, its corresponding parameters appear in the Acquisition toolbar. The data source
(spectrometer) is listed in the Source box.
►
Procedure
To display a spectral graph, follow the steps below:
1. Select File | New | Spectrum Graph
Or
Click
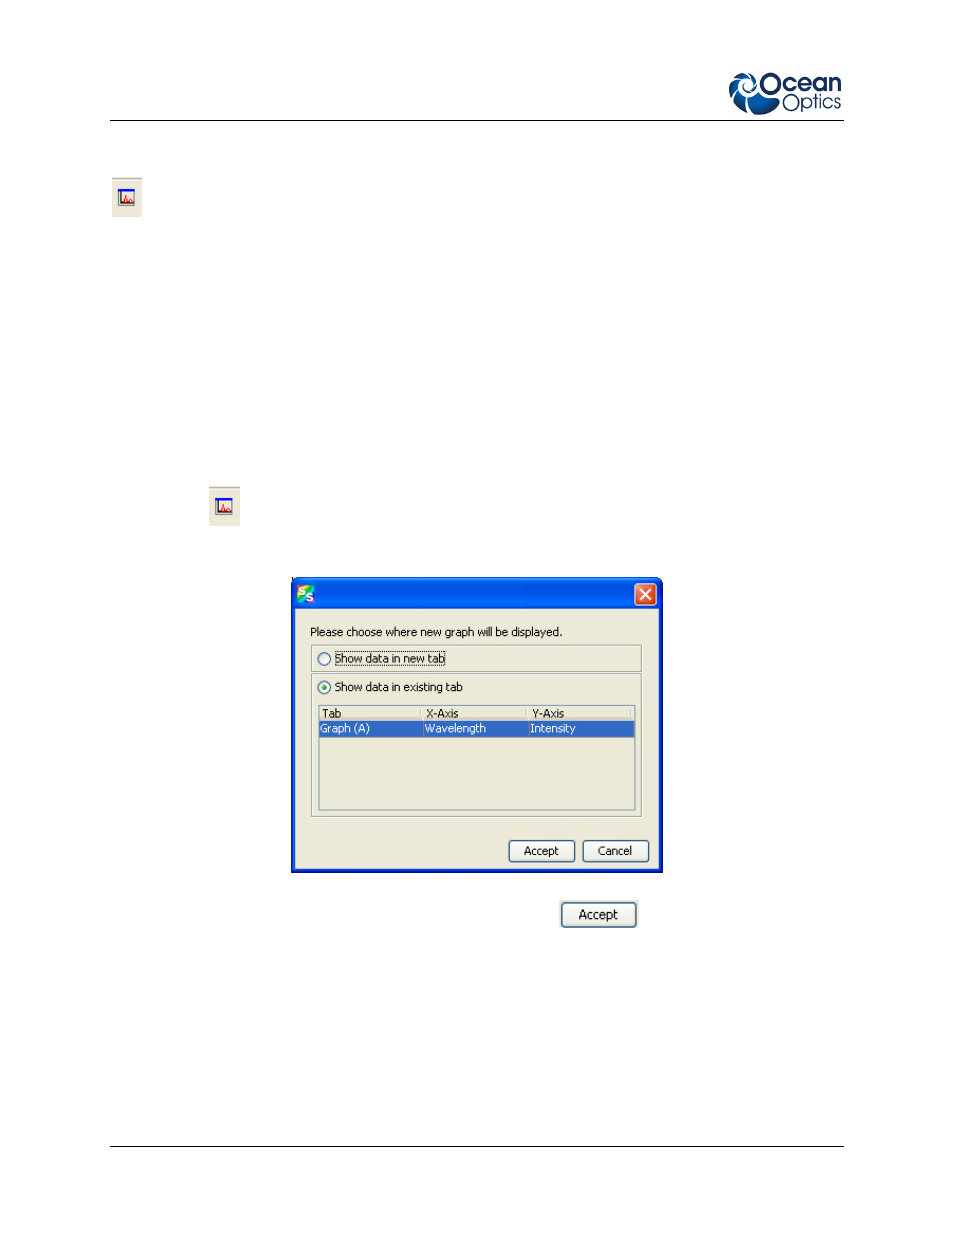
in the Data Display toolbar. A dialog box appears asking if you want to display the
new graph in the current graph tab, or start a new graph tab.
2. Choose where the new graph will be displayed and click
.
3. Set the desired parameters (integration time, scans to average, and boxcar width).
The sample below shows a graph with three spectral curves (blue, pink and orange) in the same
graph tab.
- Apex 785 Raman (1 page)
- STS-UV (2 pages)
- TR2 Engineering Note (4 pages)
- SAD500 Communications and Control (19 pages)
- Red Tide USB650 Install (26 pages)
- Fiber Optic Termination Kit (6 pages)
- Transmissive pH Probe (10 pages)
- Remora (42 pages)
- PlasCalc (59 pages)
- Correcting Device Driver Issues (8 pages)
- ecoVis Krypton Light Source (16 pages)
- LPC-500CM (28 pages)
- HPX-2000 (24 pages)
- ADC1000-USB (27 pages)
- Torus Operating Instructions (30 pages)
- ADC2000-PCI (13 pages)
- Sensors for Real-Time Analysis (2 pages)
- IDRaman reader (2 pages)
- DH-2000-CAL (30 pages)
- QE65 Pro (32 pages)
- Collimating Lenses (2 pages)
- D1000 (2 pages)
- IDRaman mini (2 pages)
- HR2000CG-UV-NIR (42 pages)
- Cool Red (1 page)
- HL-2000 (20 pages)
- XE-1 Xenon (6 pages)
- USB-ADP Serial Adapters (3 pages)
- CHEM2000 (36 pages)
- Deuterium-Halogen Calibration Light Source (19 pages)
- NeoFox Engineering Note (30 pages)
- QE Pro (2 pages)
- OOIBase32 (140 pages)
- AR-1 Argon (6 pages)
- pH Sensor Patches, Probes and Cuvettes (36 pages)
- SpecLine Offline Spectroscopy (60 pages)
- HL-2000-HP-232 (26 pages)
- External Triggering Options Instructions for Spectrometers with Firmware Version 3.0 and Above (16 pages)
- Breakout Box (10 pages)
- USB-ISS-UV_VIS (4 pages)
- ISS-UV_VIS (6 pages)
- OOIColor (14 pages)
- LS-1 Series (12 pages)
- Apex Install (24 pages)
- DH-2000 (34 pages)