Ocean Optics SpectraSuite User Manual
Page 138
10: Strip Charts
126
000-20000-300-02- 201110
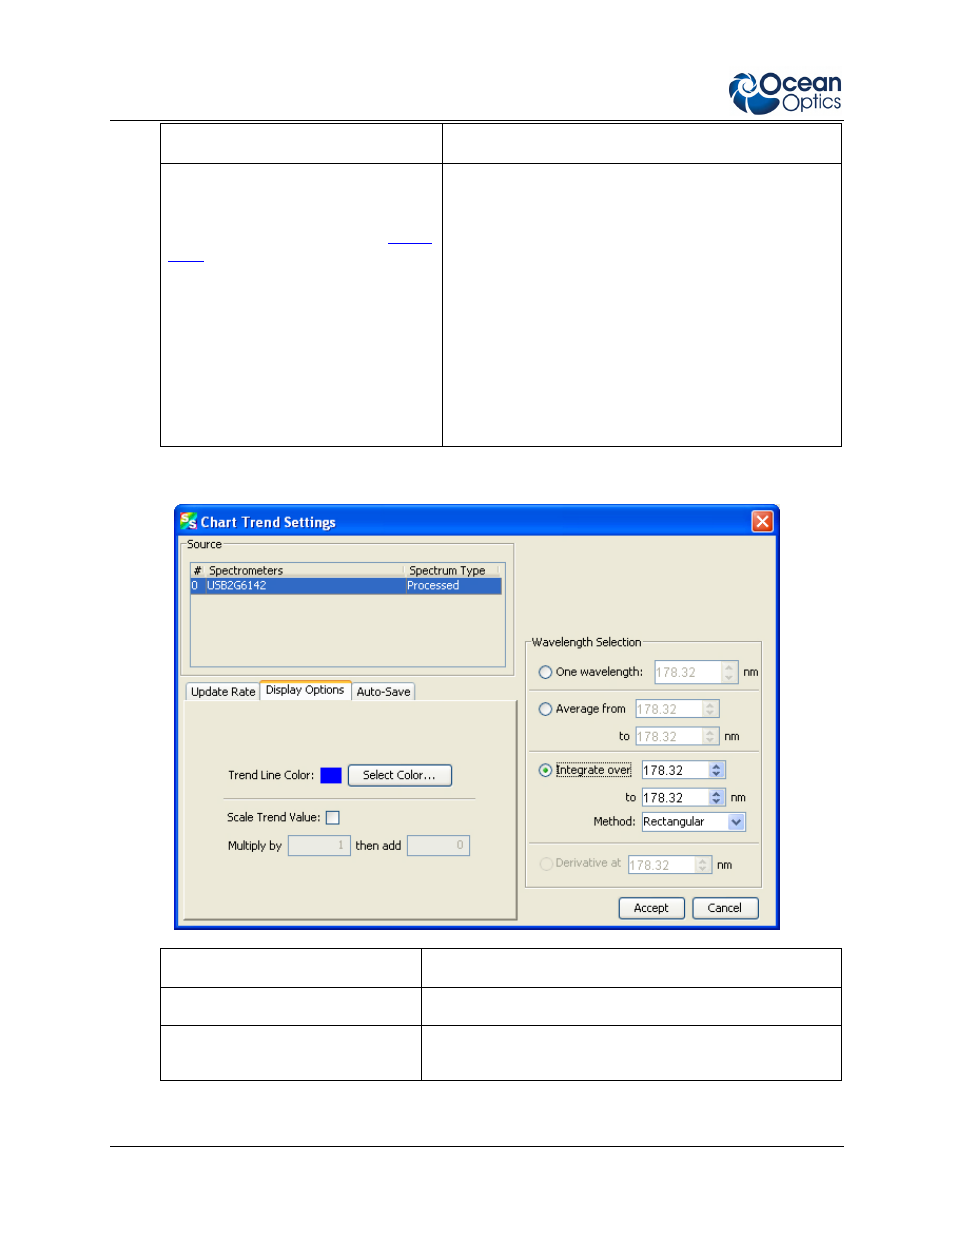
Field
Selections
Range Selection
This section varies, depending on the
units chosen for the x-axis (see
Select the type of data for which you want to view the
time trend from the following:
One wavelength – For one pixel (used in
fluorescence, for example). Select the
wavelength.
Average from – For a range of pixels. Select
the starting and ending wavelengths.
Integrate over – For the area underneath the
trend line. Select the starting and ending
wavelengths. Then, select the method for
calculating the continuous area underneath the
graph curve: Rectangular, Simpson’s, or
Trapezoid.
6. Click the Display Options tab.
Field
Selections
Display Options
Select a color for the graph’s trend line.
Scale Trend Value
If you would like to adjust your data, enter the appropriate
information in this field.
7. Click the Auto-Save tab.
- Apex 785 Raman (1 page)
- STS-UV (2 pages)
- TR2 Engineering Note (4 pages)
- SAD500 Communications and Control (19 pages)
- Red Tide USB650 Install (26 pages)
- Fiber Optic Termination Kit (6 pages)
- Transmissive pH Probe (10 pages)
- Remora (42 pages)
- PlasCalc (59 pages)
- Correcting Device Driver Issues (8 pages)
- ecoVis Krypton Light Source (16 pages)
- LPC-500CM (28 pages)
- HPX-2000 (24 pages)
- ADC1000-USB (27 pages)
- Torus Operating Instructions (30 pages)
- ADC2000-PCI (13 pages)
- Sensors for Real-Time Analysis (2 pages)
- IDRaman reader (2 pages)
- DH-2000-CAL (30 pages)
- QE65 Pro (32 pages)
- Collimating Lenses (2 pages)
- D1000 (2 pages)
- IDRaman mini (2 pages)
- HR2000CG-UV-NIR (42 pages)
- Cool Red (1 page)
- HL-2000 (20 pages)
- XE-1 Xenon (6 pages)
- USB-ADP Serial Adapters (3 pages)
- CHEM2000 (36 pages)
- Deuterium-Halogen Calibration Light Source (19 pages)
- NeoFox Engineering Note (30 pages)
- QE Pro (2 pages)
- OOIBase32 (140 pages)
- AR-1 Argon (6 pages)
- pH Sensor Patches, Probes and Cuvettes (36 pages)
- SpecLine Offline Spectroscopy (60 pages)
- HL-2000-HP-232 (26 pages)
- External Triggering Options Instructions for Spectrometers with Firmware Version 3.0 and Above (16 pages)
- Breakout Box (10 pages)
- USB-ISS-UV_VIS (4 pages)
- ISS-UV_VIS (6 pages)
- OOIColor (14 pages)
- LS-1 Series (12 pages)
- Apex Install (24 pages)
- DH-2000 (34 pages)