Qe65000 spectrometer exposure image features, Exposure image – Ocean Optics SpectraSuite User Manual
Page 86
6: Spectrometer Menu Functions
74
000-20000-300-02- 201110
Feature
Meaning
Wavelength
Allows you to enter or change the spectrometer’s wavelength calibration
coefficients. Wavelength coefficients are provided on the Wavelength
Calibration Data Sheet that came with the spectrometer.
Network Spectrometer
Enables you to configure a wireless connection for a spectrometer using
the Remora adapter or a Jaz spectrometer with the Ethernet module.
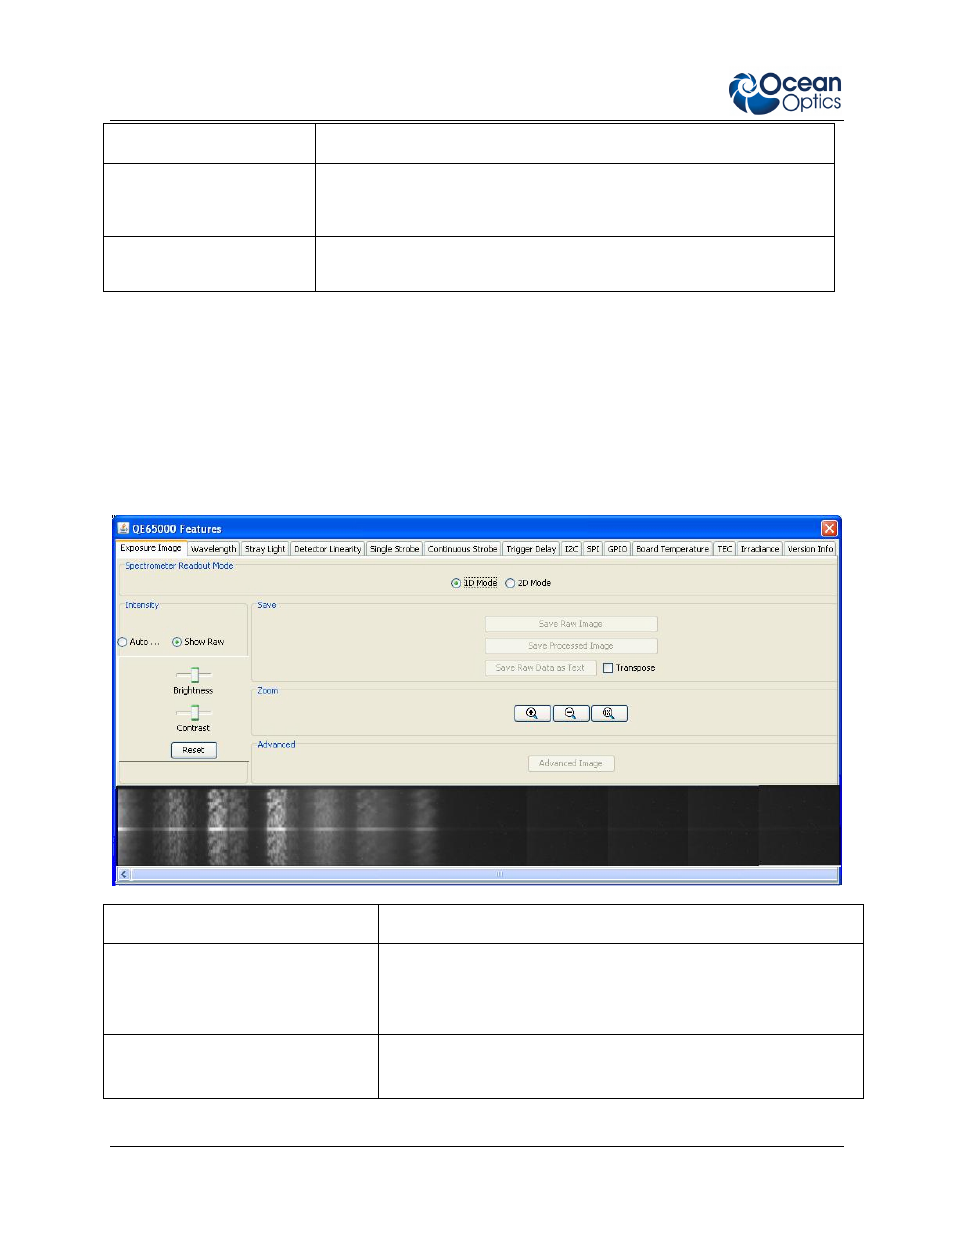
QE65000 Spectrometer Exposure Image Features
The following are CCD exposure image features for the QE65000 Spectrometer. Use this screen to view
the raw data coming from the detector for visualization and analysis. The bottom of this screen displays
the actual CCD image (a 2-dimensional image of the detector). Each light stripe is a spectral line. The
vertical white lines correspond to peaks.
Exposure Image
Feature
Meaning
Spectrometer Readout Mode
Select either 1- or 2-dimensional:
1D: A snapshot of the detector (detector image is static)
2D: View updates every time a new scan completes (detector
image is dynamic)
Intensity
Auto Equalize
Controls how the image is processed and provides the following
controls:
Adjust for better contrast in the CCD image.