Overlay visible spectrum spectrum range, Overlay, Visible spectrum – Ocean Optics SpectraSuite User Manual
Page 72: Spectrum range
5: View Menu Functions
60
000-20000-300-02- 201110
Overlay
Use this function to add an overlay to the selected graph.
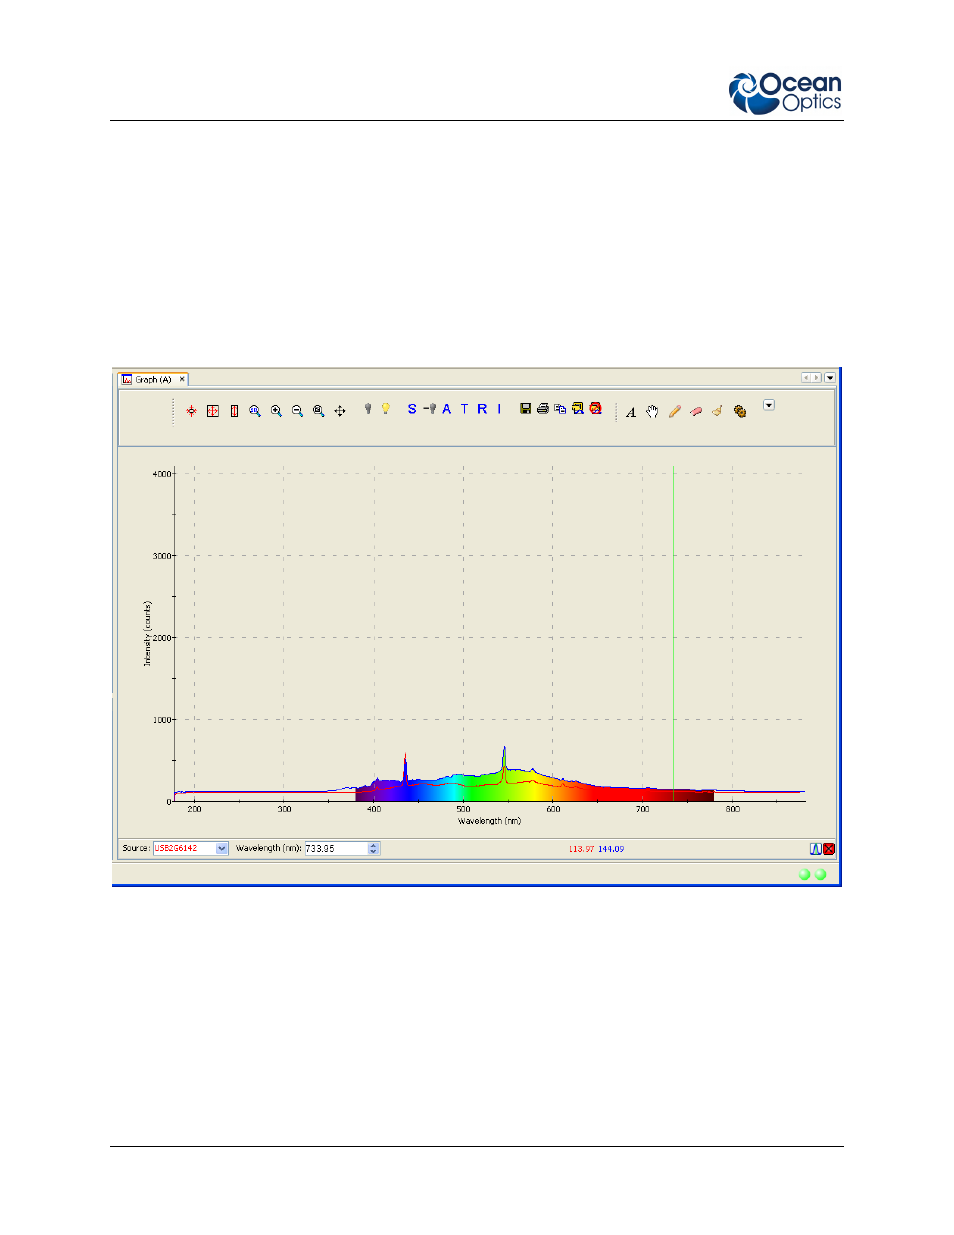
Visible Spectrum
This option allows you to display the visible spectrum on your graph. You can display the spectrum the
full height of the chart, as a bar on the x-axis, or beneath the selected trend line (as shown in figure
below).
Spectrum Range
Spectrum Range allows you to display captions for the following spectrum ranges: Gamma, X-ray, UV,
Visible, Near infrared, Mid infrared, Far infrared, Microwaves, and Radiowaves.
See also other documents in the category Ocean Optics Equipment:
- Apex 785 Raman (1 page)
- STS-UV (2 pages)
- TR2 Engineering Note (4 pages)
- SAD500 Communications and Control (19 pages)
- Red Tide USB650 Install (26 pages)
- Fiber Optic Termination Kit (6 pages)
- Transmissive pH Probe (10 pages)
- Remora (42 pages)
- PlasCalc (59 pages)
- Correcting Device Driver Issues (8 pages)
- ecoVis Krypton Light Source (16 pages)
- LPC-500CM (28 pages)
- HPX-2000 (24 pages)
- ADC1000-USB (27 pages)
- Torus Operating Instructions (30 pages)
- ADC2000-PCI (13 pages)
- Sensors for Real-Time Analysis (2 pages)
- IDRaman reader (2 pages)
- DH-2000-CAL (30 pages)
- QE65 Pro (32 pages)
- Collimating Lenses (2 pages)
- D1000 (2 pages)
- IDRaman mini (2 pages)
- HR2000CG-UV-NIR (42 pages)
- Cool Red (1 page)
- HL-2000 (20 pages)
- XE-1 Xenon (6 pages)
- USB-ADP Serial Adapters (3 pages)
- CHEM2000 (36 pages)
- Deuterium-Halogen Calibration Light Source (19 pages)
- NeoFox Engineering Note (30 pages)
- QE Pro (2 pages)
- OOIBase32 (140 pages)
- AR-1 Argon (6 pages)
- pH Sensor Patches, Probes and Cuvettes (36 pages)
- SpecLine Offline Spectroscopy (60 pages)
- HL-2000-HP-232 (26 pages)
- External Triggering Options Instructions for Spectrometers with Firmware Version 3.0 and Above (16 pages)
- Breakout Box (10 pages)
- USB-ISS-UV_VIS (4 pages)
- ISS-UV_VIS (6 pages)
- OOIColor (14 pages)
- LS-1 Series (12 pages)
- Apex Install (24 pages)
- DH-2000 (34 pages)