Query port report, Figure 176 query port report – Raritan Engineering Command Center CC-SG User Manual
Page 164
148 C
OMMAND
C
ENTER
S
ECURE
G
ATEWAY
A
DMINISTRATOR
G
UIDE
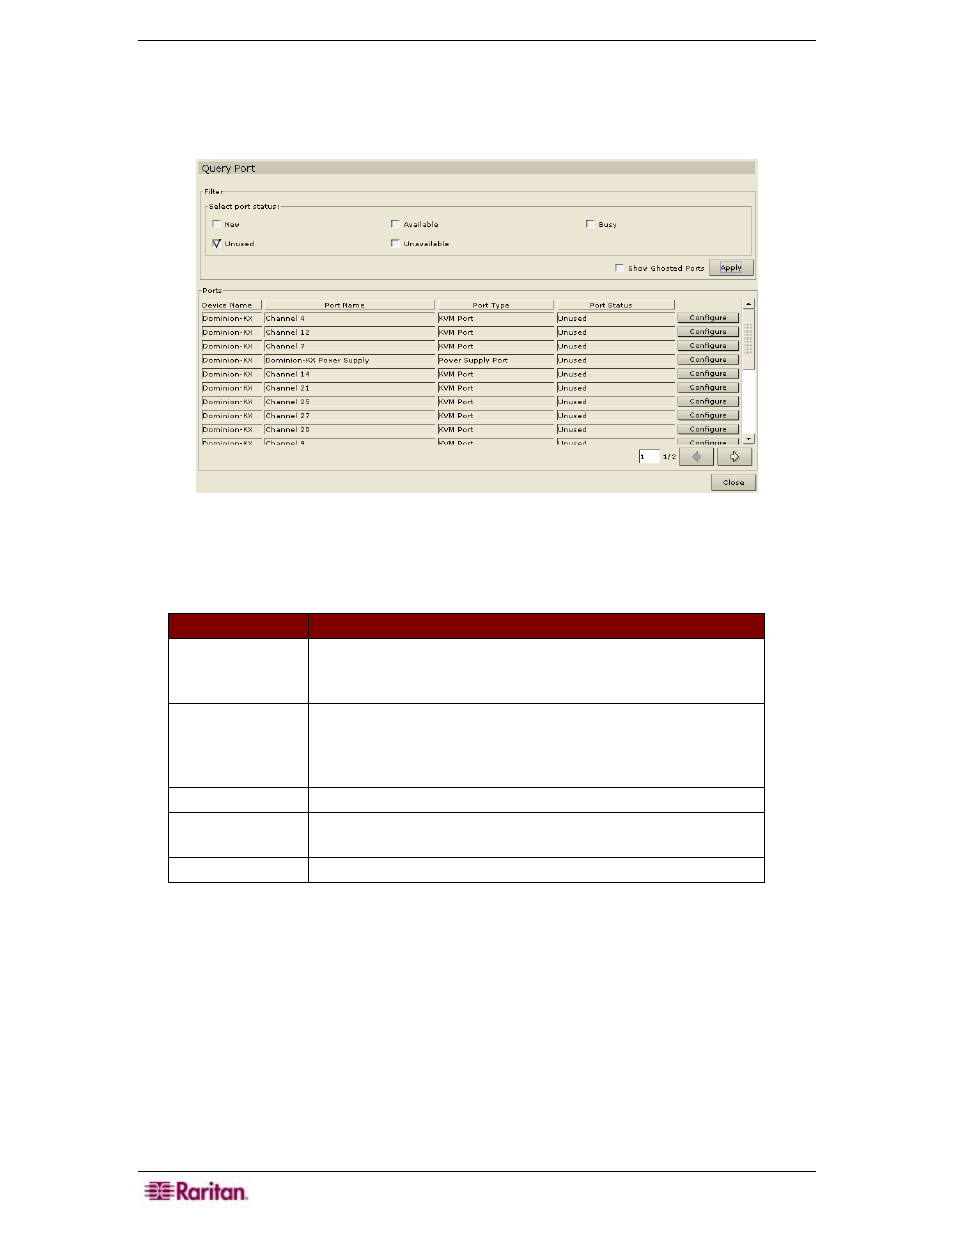
Query Port Report
The Query Port Report displays all ports according to port status.
1. On the Reports menu, click Query Port. The Query Port screen appears.
Figure 176 Query Port Report
2. Click on one or more checkboxes to customize the port information you want to see in the
report.
P
ORT
S
TATUS
D
EFINITION
New
Port is available (physical connection to target server is in
place), but the port has not been configured. Click Configure
next to the port in the report to configure it now.
Unused
Port is unavailable (physical connection to target server is not
in place) and the port has not been configured. Click
Configure next to the port in the report to configure it now if
the device is available.
Available
Port has been configured and connection to port is possible.
Unavailable
Connection to port is not possible since the device is down and
unavailable.
Busy
A user is connected to this port.
3. Click Apply to generate the report. Checking more than one checkbox and clicking Apply
will display ports with ALL statuses that are selected.
4. Check the Show Ghosted Ports checkbox in conjunction with one or more port statuses to
display ports that have the selected port status in addition to being ghosted. A ghosted port
can occur when managing Paragon devices and when a CIM or target server is removed from
the system or powered off (manually or accidentally). Refer to Raritan’s Paragon II User
Manual for additional information.
5. Click on any of the column headers to sort the ports by that attribute in ascending order. Click
on the header again to sort the ports in descending order.
6. Click Close to close the Query Port report.