Rockwell Automation 1756-HIST2G Historian ME 2.1 User Manual
Page 67
4 • V
IEWING
D
ATA
57
A
UTO
R
EFRESH
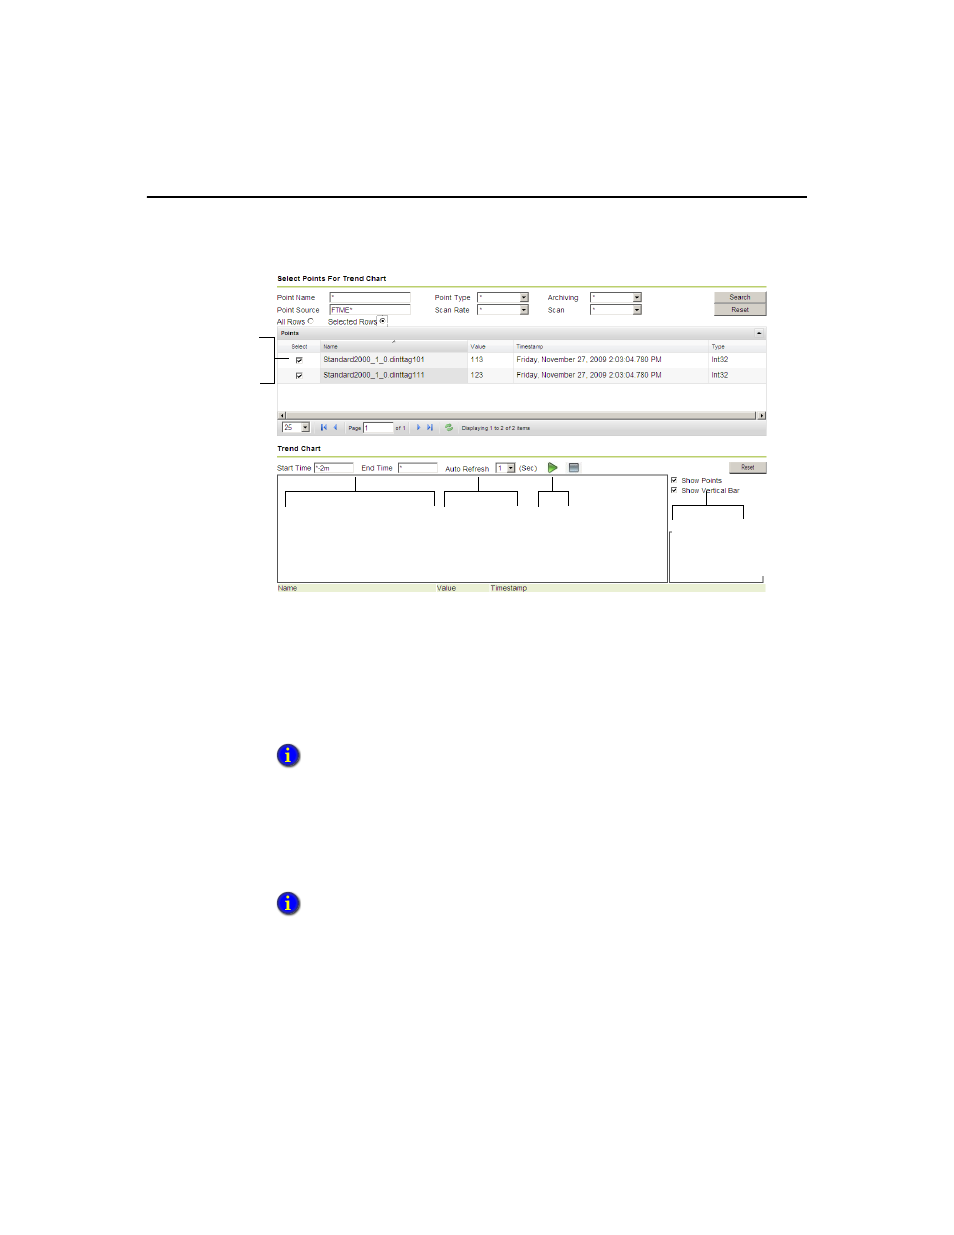
Click the green arrow to generate a trend chart for selected points in the table.
Timestamps on the Y axis change as time passes and the chart refreshes. Click the red
box to stop Auto Refresh. Auto Refresh must be disabled before you use the Zoom,
Show Points, or Show Vertical Bar features.
S
HOW
P
OINTS
Check the Show Points checkbox to display discrete data points in the trend chart.
Each point will be represented in the chart as a bubble. You must disable Auto
Refresh (by clicking the red square) before you enable the Show Points feature.
See the section “Start and End Times” for more details about setting the start and end
times.
If you want to draw a trend chart that consists of high speed points, avoid checking the
Show Points checkbox due to the large number of points that will be displayed.
Select points
to view in
Trend Chart
Enter Start Time
and
End Time range
Select
Auto
Refresh rate
Enable
Show Points and
Show Vertical Bar
Click green
arrow to draw the
trend chart