Triton TritonMap User Manual
Page 112
June 2004 DelphMap™ User's Manual
• If your profile is a mix of sidescan and bathy layers, the displayed profile
has panels for both amplitude (for sidescan layers) and depth (for bathy
layers). Figure 49 shows an example of that kind of graph. In the
example, notice that the amplitude signal is absent beyond 50 meters
into the profile of the sidescan data, but that the bathy profile continues
for the remainder of the profile. This indicates that the user’s profile
started somewhere in the sidescan data layer but then went beyond an
edge of the sidescan data. The bathy data, on the other hand,
persisted for the entire profile in the example, so the bathy layer
covered more area than the sidescan layer.
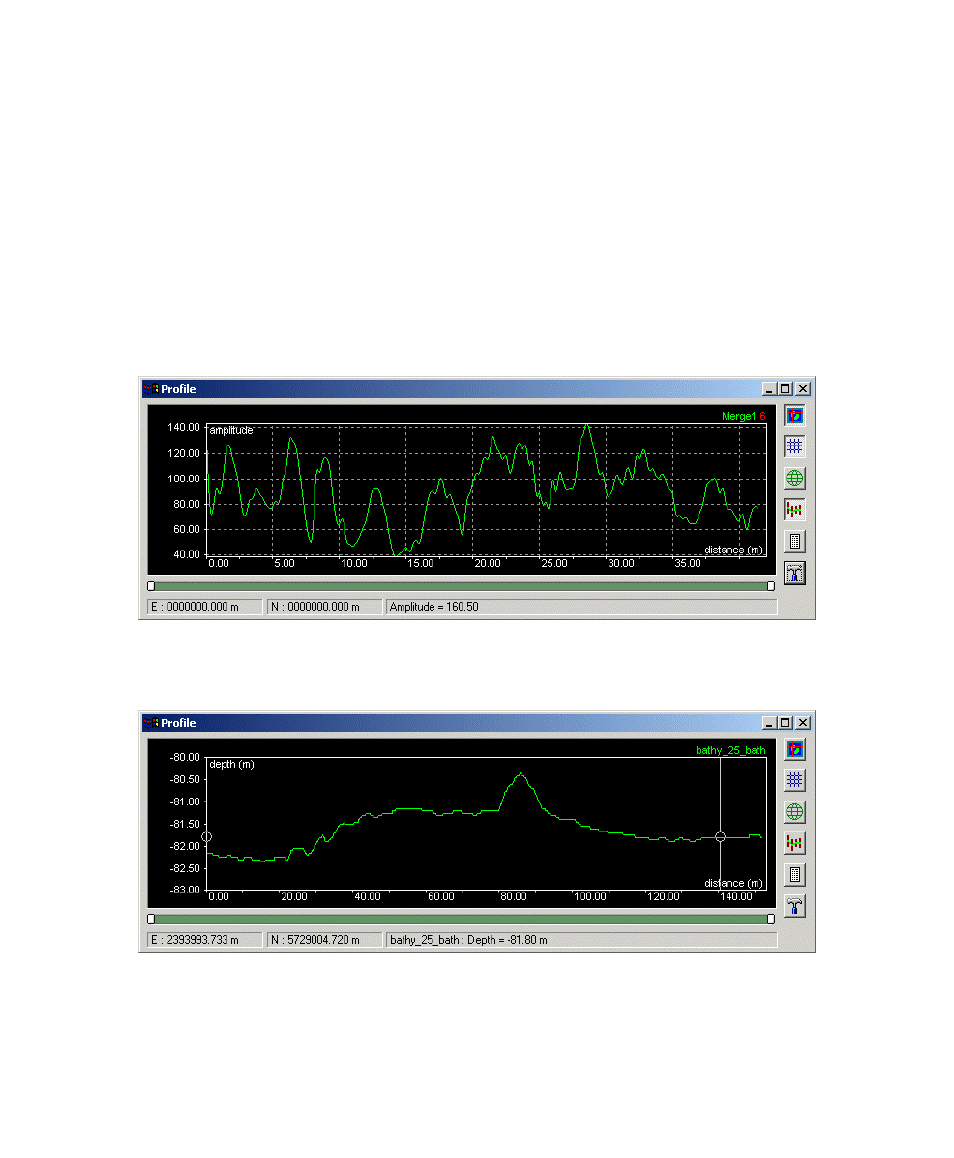
FIGURE 47. Amplitude profile of a side-scan layer
FIGURE 48. Depth profile of a bathy layer as a display profile
Chapter 6: Displaying Image Profiles
98