Graphic history, Figure 41, Graphical display – Vaisala PTU300 User Manual
Page 72: Table 13, Periods for trend and max/min calculations, Graphic history on p, 70 a
User's Guide _______________________________________________________________________
70 ___________________________________________________________________ M210796EN-G
Graphic History
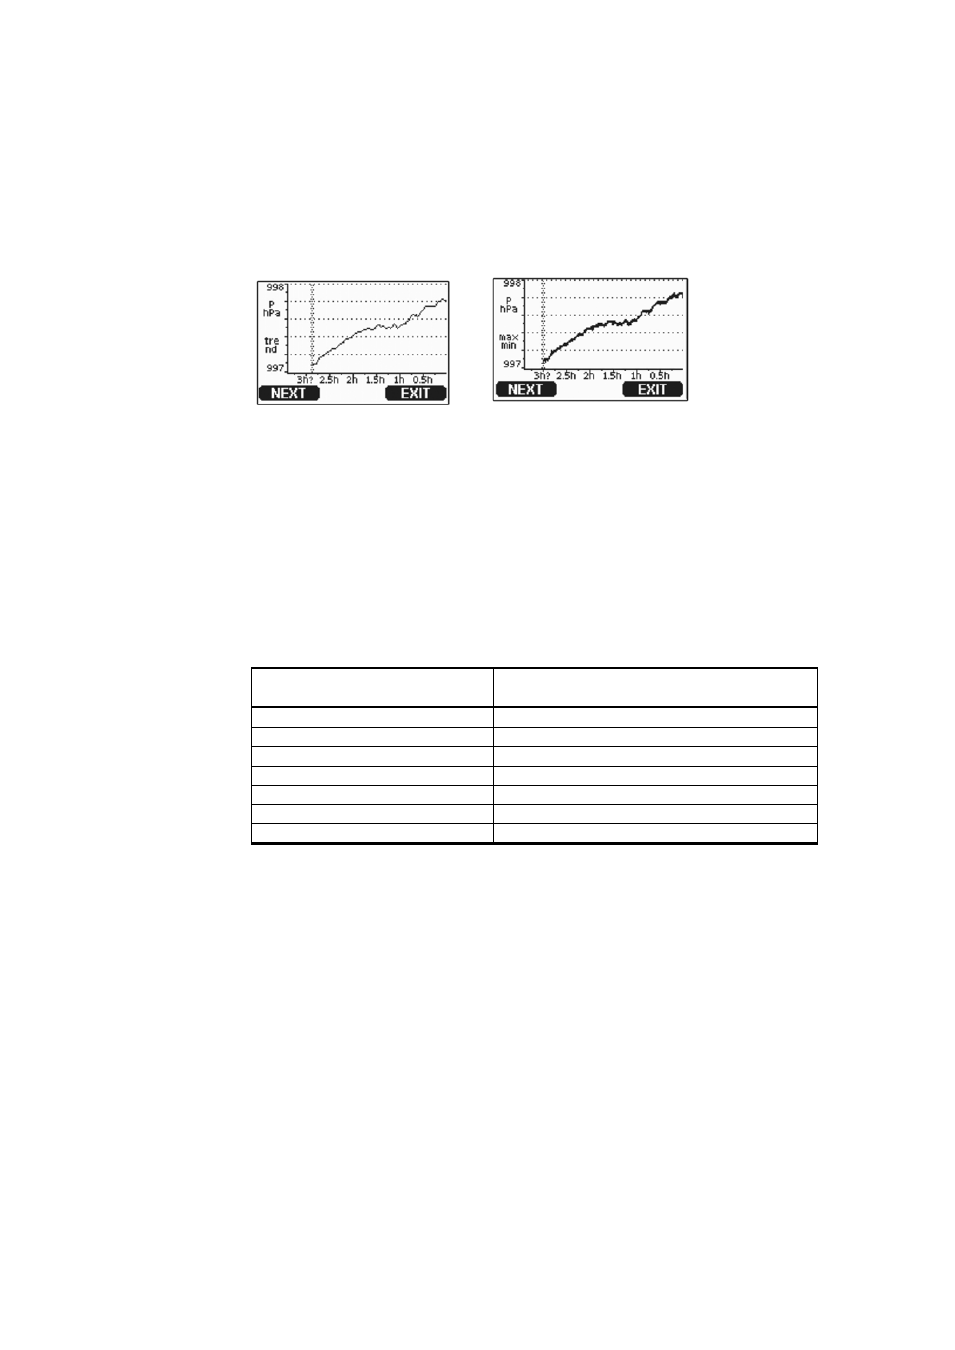
The graphical display shows the data trend or min/max graph of the
selected quantities, one at a time. The graph is updated automatically
while measuring.
0706-052
Figure 41
Graphical Display
Trend graph: Shows you a curve of average values. Each value is a
calculated average over a period. See Table 13 below.
Max/min graph: Shows you the minimum and maximum values in a
form of curve. Each point shows the absolute minimum and maximum
observed during the time period represented by the data point. See Table
13 below.
Table 13
Periods for Trend and Max/Min Calculations
Observation Period
Period for Trend/Max/Min
Calculations (Resolution)
20 minutes
10 seconds
3 hours
90 seconds
1 day
12 minutes
10 days
2 hours
2 months
12 hours
1 year
3 days
4 year*
12 days
* Shows the maximum logging period of the data logger module (available when data
logger module is installed)
Use the following functions in the graphical display:
- Press the NEXT button to change between the trend graph and
max/min graph for the quantities selected for display.
- Press the EXIT button to return to the basic display.
-
Press the ▼▲ arrow buttons to zoom in and out in the graph window.
-
Press the ◄► arrow buttons move the cursor (vertical bar) along the
time axis. The cursor mode allows you to observe individual
measuring points. The numerical value at the cursor position is shown
at the left upper corner. The right upper corner shows the time from
the present to the chosen moment (without the logger module), or the
date and time at the cursor position (when the logger module is
installed).