Pressure 3h trend and tendency reading, Using basic display, Pressure tendency graphics and codes – Vaisala PTU300 User Manual
Page 69: Figure 39, Basic display with p, Trend and tendency
Chapter 4 _________________________________________________________________ Operation
VAISALA ________________________________________________________________________ 67
Pressure 3h Trend and Tendency
Reading
Using Basic Display
0604-056
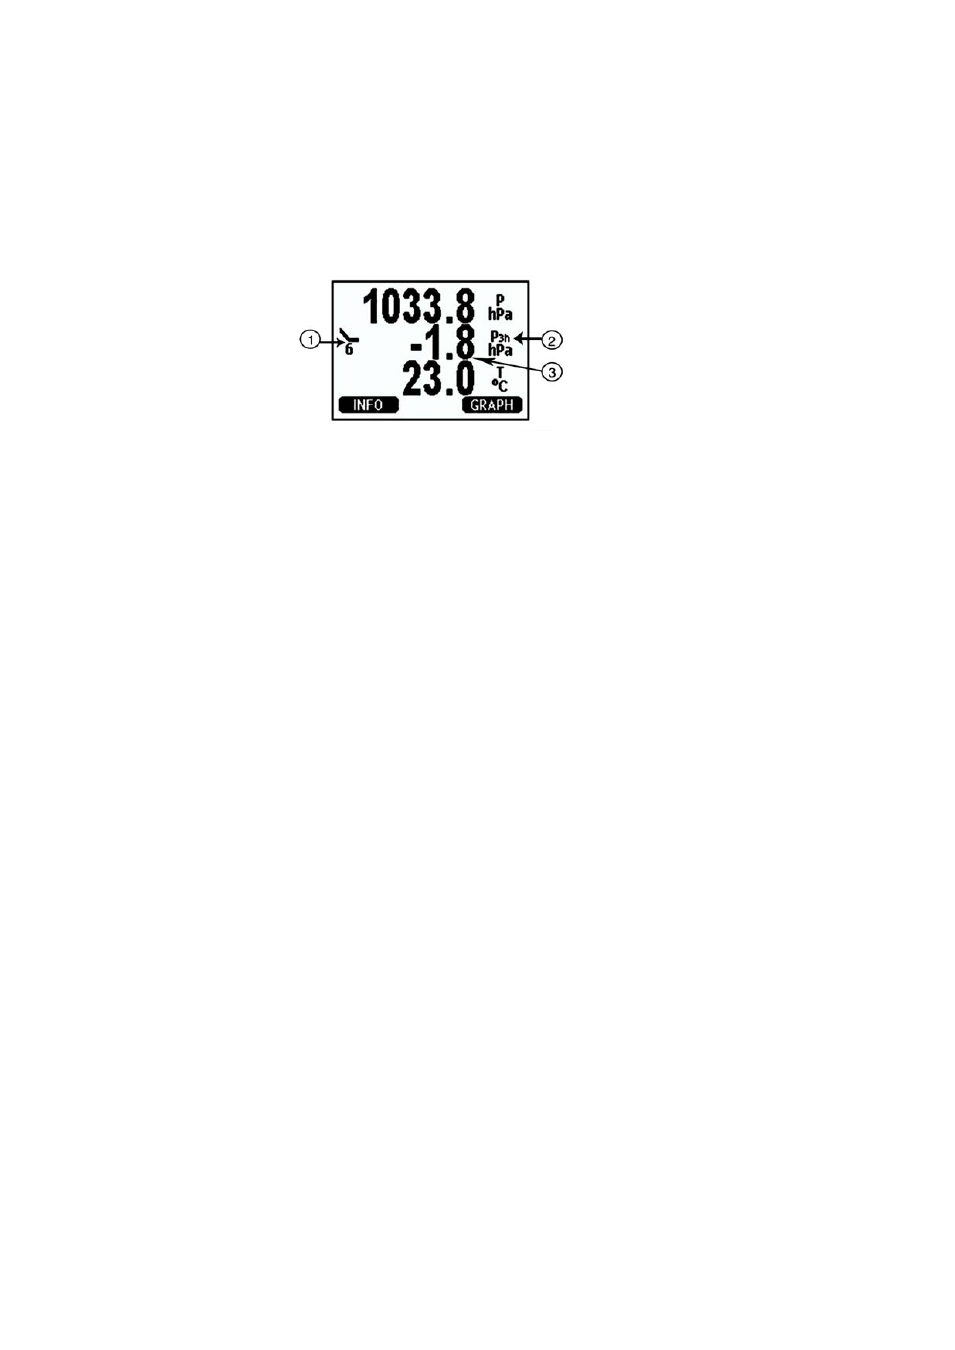
Figure 39
Basic Display with P
3H
Trend and Tendency
The following numbers refer to Figure 39 above:
1
=
Tendency: Increasing/decreasing graph symbol with the code
number (for more information, see Figure 40 on page 68)
2
=
P3h symbol
3
=
Trend (middlemost numeric value)
Pressure tendency graphics and codes
The characteristic symbols of pressure tendency during the three hours
preceding the time of observation are described in Figure 40 on page 68.
Source: The World Meteorological Organization (WMO) publication
Manual on Codes Vol. I.1, International Codes, Part A - Alphanumerical
Codes, 1995 Edition, WMO - No. 306. Section C, Code Table 0200: a.