Query workbench query details, Explain plan – HP Neoview Release 2.5 Software User Manual
Page 96

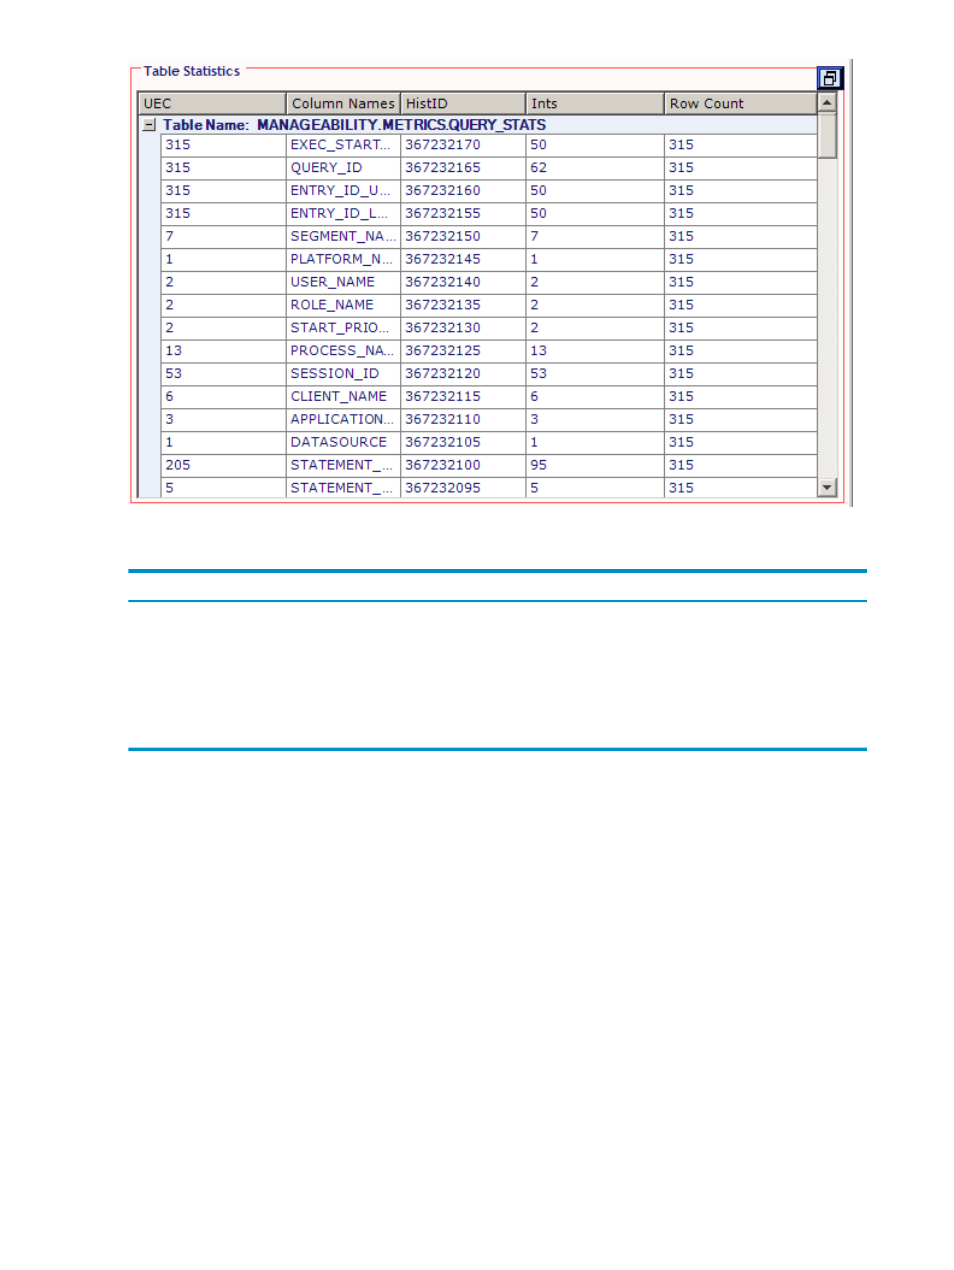
The columns shown in the Table Statistics include:
Description
Column
Unique entry counts.
UEC
Column names in the table.
Column Names
Histogram ID.
HistID
Histogram intervals.
Ints
Count of the rows.
Row Count
Query Workbench Query Details
The Query Details box contains the Explain Plan and Execute Output tabs.
Explain Plan
The Explain Plan area shows the query plan output in a tree view format. The Explain Plan area
is divided into three sections. The left section shows the query plan in tree view format. The
middle section shows details about the plan in grid form. See
“Analyze the Explain Plan Through
. The right section shows the
“Plan Summary and Operator Details” (page 99)
which includes the Cost Details and Description columns of the Explain output. Tool tips provide
information throughout the query plan output. Additionally, you can get in-depth information
about each operator in the query plan by right clicking on the operator and choosing “Help.”
This points you to in-depth information about the operators in the Neoview Query Guide. For
information about the EXPLAIN statement, see the Neoview SQL Reference Manual.
For additional information about NPA and query plans, see the Neoview course Neoview
Performance Analyzer and Query Plan Workshop, course ID 01105317. This course is designed to
simplify explain plans by utilizing Neoview Performance Analyzer (NPA) to review query plans,
identify common problems, and demonstrate physical DB design best practices. For additional
information about improving query plans, see
“Tips for Query Plan Performance Improvements”
96
Use the Query Workbench
