HP Neoview Release 2.5 Software User Manual
Page 42

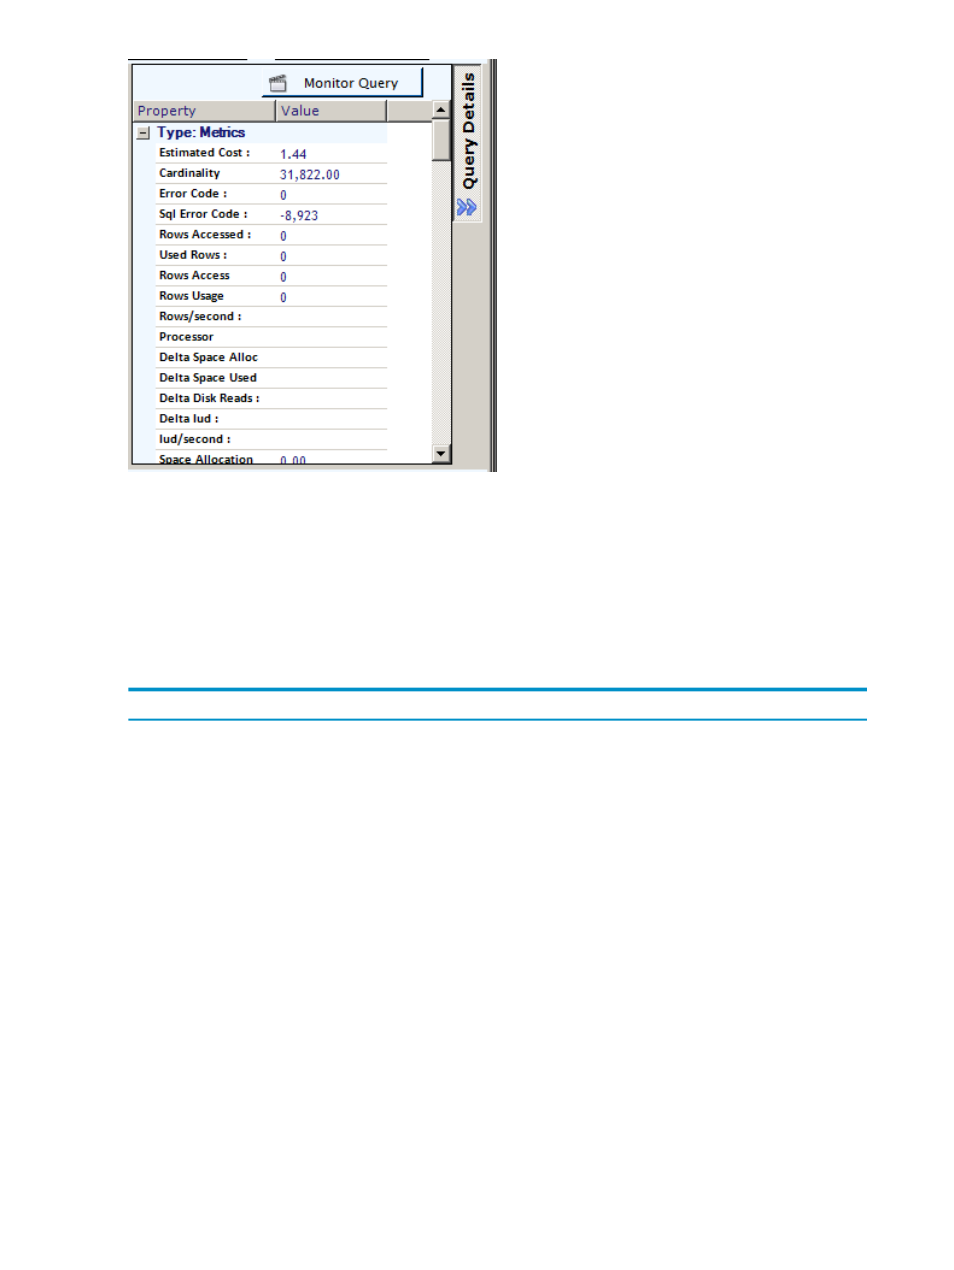
When you click on [Monitor Query], Live View brings up the Query Details window for the
query that allows you to watch query executions. You can watch multiple running queries
simultaneously. The same “watch” or monitoring functionality can also be achieved by
double-clicking on a query in the Live View (grid containing the list of running queries). This
information is only available for queries that are currently running or that completed recently
(that is, queries for which Neoview WMS has information).
The Query Details window provides a detailed view of the query and shows the query text and
the metrics related to the query split into these categories:
Description
Category
Indicates metrics relating to the time dimension. Depending on the
version of the platform you are connected to, the set of information
displayed will vary. See
“Time-Based Metrics” (page 46)
.
“Time-Based Metrics” (page 46)
Indicates the rate of consumption of resources or rate of counters since
the previous time interval. This is the difference between the samples
of the last 2 intervals (current – previous). See
.
“Rate-Based Metrics” (page 47)
Provides a view of the estimates of resources required by a query. This
information is static for a query (meaning it does not change while a
query executes). See
“Compile-Time Metrics” (page 48)
.
“Compile-Time Metrics” (page 48)
Provides actual resources that have been currently consumed by the
query or metrics that relate to the current state of the query. This
information varies and changes over time (when this information is
sampled or aggregated). See
.
Catch-all bucket that contains other facts about this query, including
user information, process information, warning levels, query type,
state of the query, and so on. See
“Miscellanous Facts” (page 50)
“Miscellanous Facts” (page 50)
Represents any Neoview WMS rules that were violated on the platform
and contains details about the specific violations. This is indicated by
the query’s WARN_LEVEL (Warning Level) state going into a Low,
Medium or High state. This information is only available for platforms
enabled with Neoview WMS support for rules (that is, R2.4 and higher).
See
.
42
Neoview Workload Management Services (WMS) Configuration
