Session statistics – HP Neoview Release 2.5 Software User Manual
Page 43

Description
Category
Statistics on a per-table basis. These are the individual statistics for
each table (per-table) involved in the query. See
.
“Per-Table Statistics” (page 52)
Provides the ability to retrieve the query text associated with the
monitored query. See
.
You can click on any of the columns in the metrics to order the layout as you prefer. Additionally,
you can save a layout so that all future views are ordered in the same way. To save a layout:
•
View the Query Details for a query.
•
Change the layout of the Query Details screen by selecting columns (ascending or
descending). Do NOT close the Query Details window.
•
Select Workspace>Save from the menu bar to save the layout (*.wks). You can now close
the Query Details window.
The next query for which you view Query Details or when you restart NPA/NQV, you will see
the saved Query Details layout.
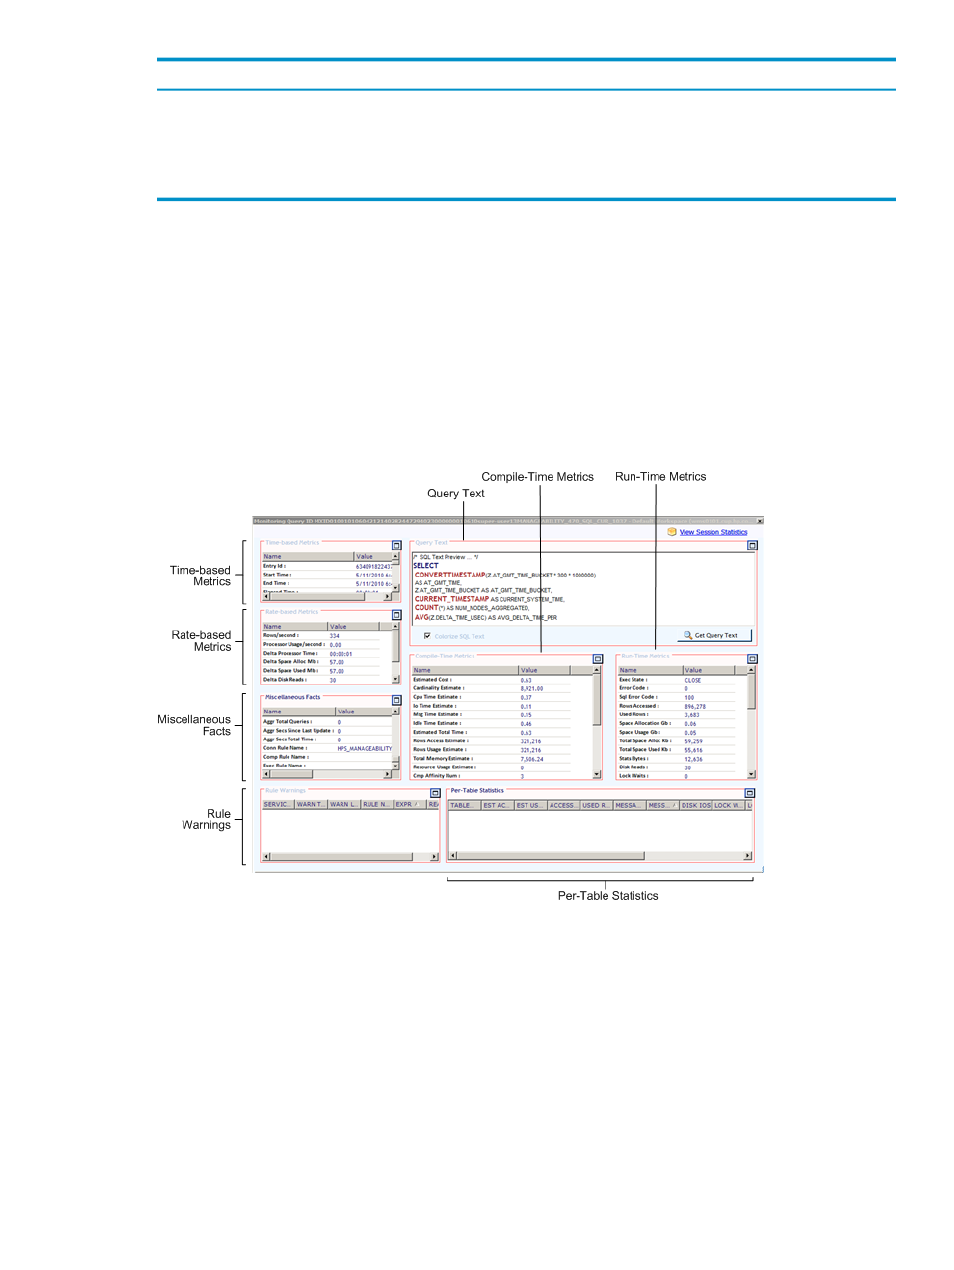
The Query Details panel:
The title corresponds to the unique query ID for the query, as well as the username and connection
information, including the data source used to connect to the Neoview platform.
Session Statistics
NPA Tools displays Session Statistics for a query that you are monitoring. Click View Session
Statistics
in the upper right corner of the Query Details (or Monitor Query) window to display
the session statistics:
Configuring Neoview WMS Services and Rules With Live View
43
