Platform status counters information – HP Neoview Release 2.5 Software User Manual
Page 54

configured and active services and the number of services that have exceeded their threshold
settings.
On the upper right corner of the summary box is a magnifying glass icon, which allows you to
drill down and display details about historical information of Neoview WMS services. Clicking
on this icon will bring up a detailed screen. See
“Statement and Service Counter Details” (page 55)
Platform Status Counters Information
Platform Status Counters provide summary information about Neoview platform performance
information. The counters provide summary information about the entire Neoview platform as
viewed by Neoview WMS. These counters are indicator values of the average node busy
percentage, the memory usage percentage, and the total number of disk I/Os and cache hits.
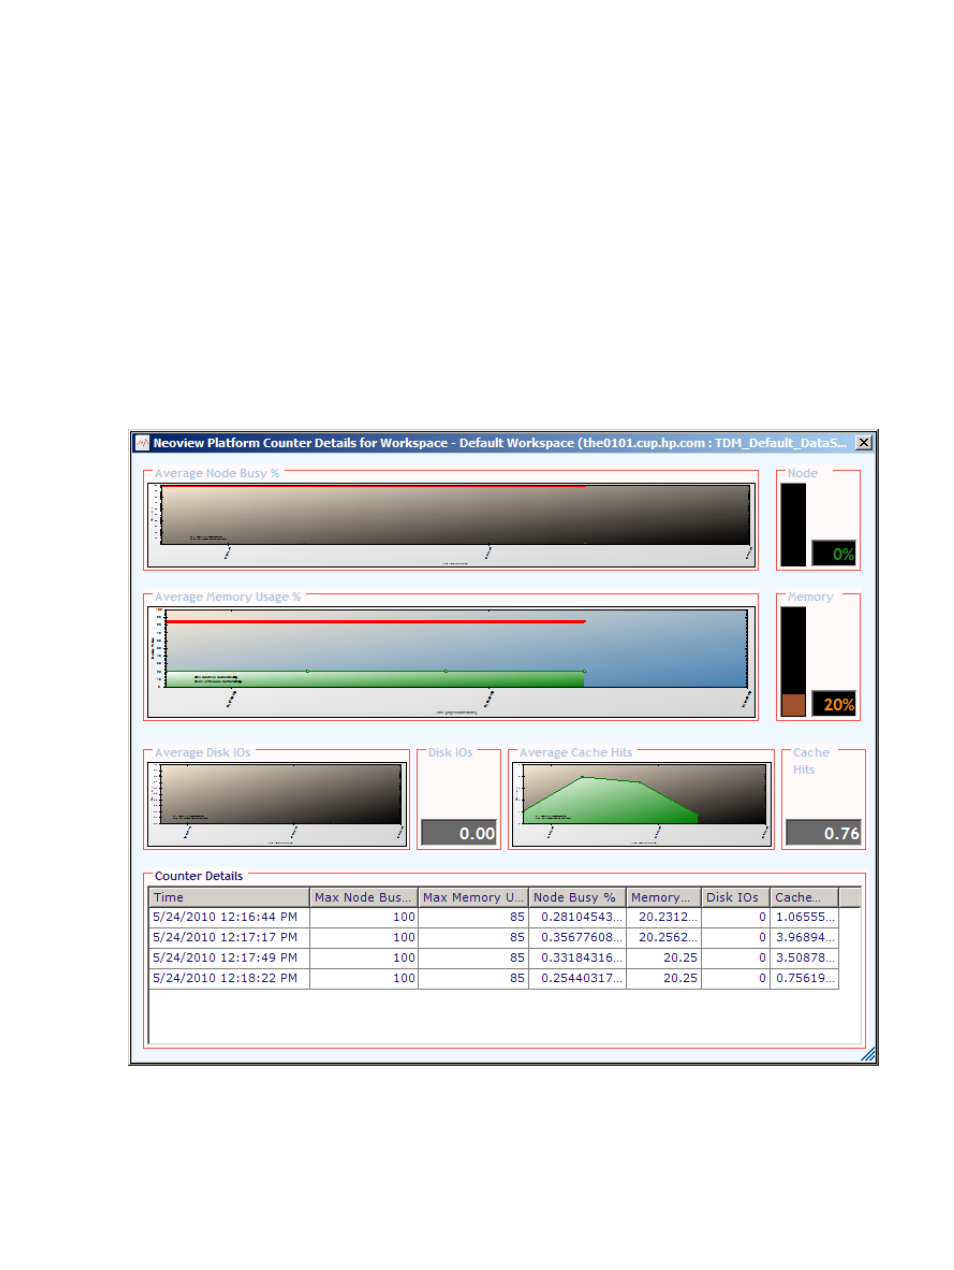
On the upper right corner of the summary box is a log graph icon, which allows you to drill
down and display details about historical information of Neoview platform performance metrics.
Clicking on this icon will bring up a detailed window that provides current Neoview platform
performance metrics and historical details of four specific Neoview platform counters (Average
Node Busy %, Average Memory Usage %, Average Disk IOs, and Average Cache Hits).
The graphical information is also displayed in a tabular form at the bottom of the screen and can
be easily copied and exported to a spreadsheet using keyboard shortcuts (Control+A to select
all rows and Control+C to copy the data).
54
Neoview Workload Management Services (WMS) Configuration
