LumaSense Technologies INNOVA 1314i User Manual
Page 189
Chapter 14
______________________________________________________________________
_____________________________________________________________________________
BE6030-12
1314i Photoacoustic Gas Monitor
LumaSense Technologies A/S
Page 189 of 199
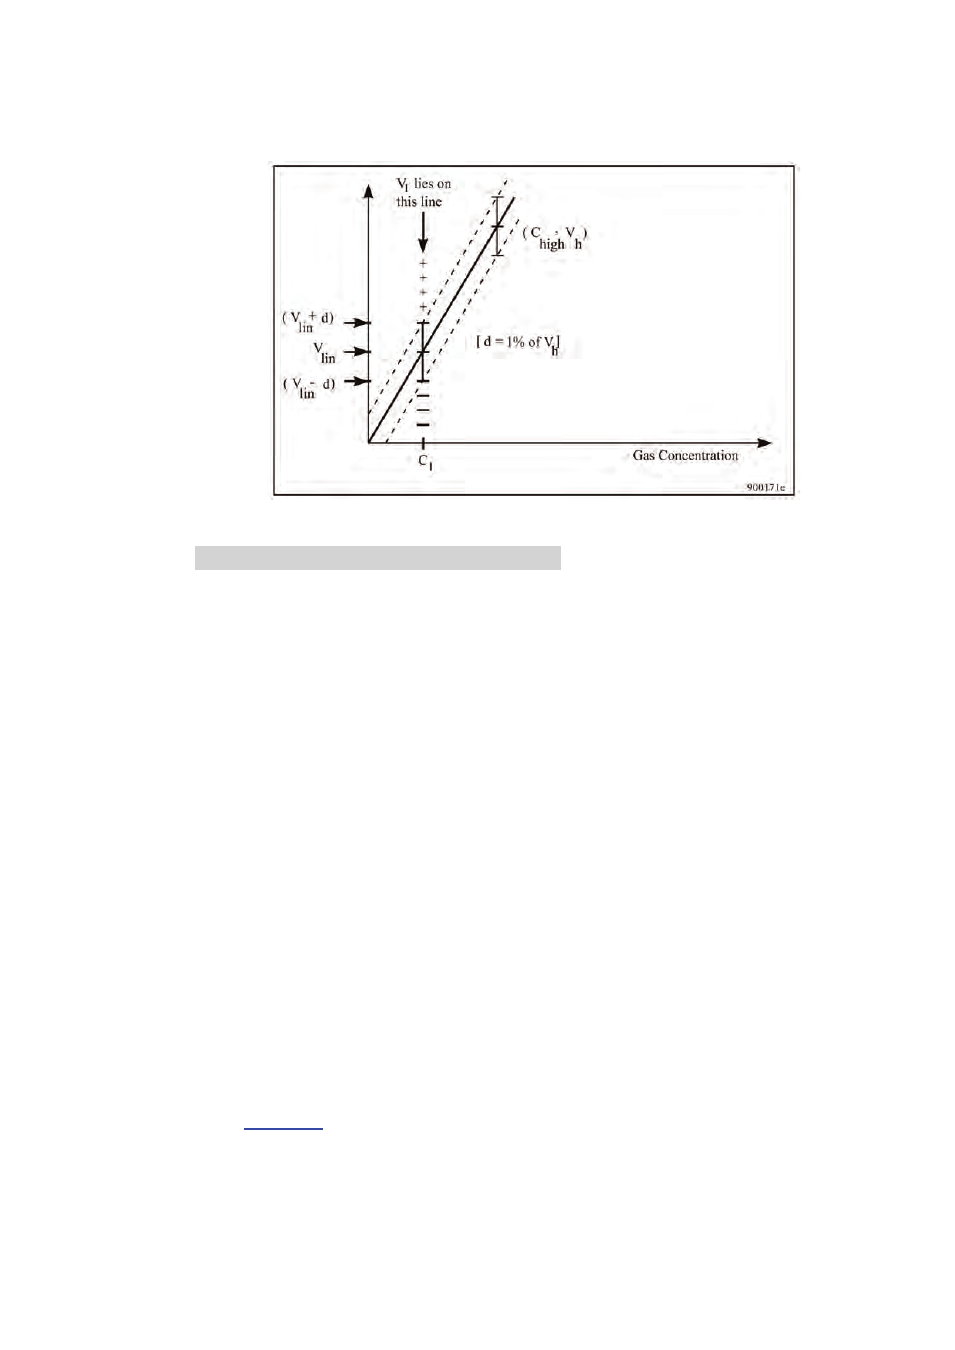
Fig.14.1 Curve illustrating the two points measured during a two-
point span calibration task
GAS X: LOW MEAS. > HIGH MEAS.
This message indicates that the signal measured in the cell when the
gas concentration was low is found to be greater than the signal when
the gas concentration was high.
The above message could indicate that the span gas concentrations
were incorrectly “entered” when the task was set-up (that is, the
“entered” low gas concentration was actually greater than the
“entered” high gas concentration). Alternatively, it could indicate that
the concentration of the gas supplied to the Monitor during the
measurement of V
low
was actually the high concentration (C
high
) and
vice versa.
The signals V
high
and V
low
have to be corrected for water-vapour
interference and cell noise, that is:
V
high
– V
offset
– V
H2O
= V
h
;
and:
V
low
– V
offset
– V
H2O
= V
l
These two points (V
h
, C
h
) and V
l
, C
l
) can then be plotted on a graph
(see
When the two signals have been measured, the Monitor then finds the
value δ = 1% of V
h
and finds out the relationship between the
measured values: