Results not yet available please wait – LumaSense Technologies INNOVA 1314i User Manual
Page 154
Chapter 12
______________________________________________________________________
_____________________________________________________________________________
BE6030-13
1314i Photoacoustic Gas Monitor
LumaSense Technologies A/S
Page 154 of 199
RESULTS NOT YET AVAILABLE
PLEASE WAIT
Once the first measurement result is available the screen text
illustrated above is replaced by a screen displaying the
measurement results – for example the following:
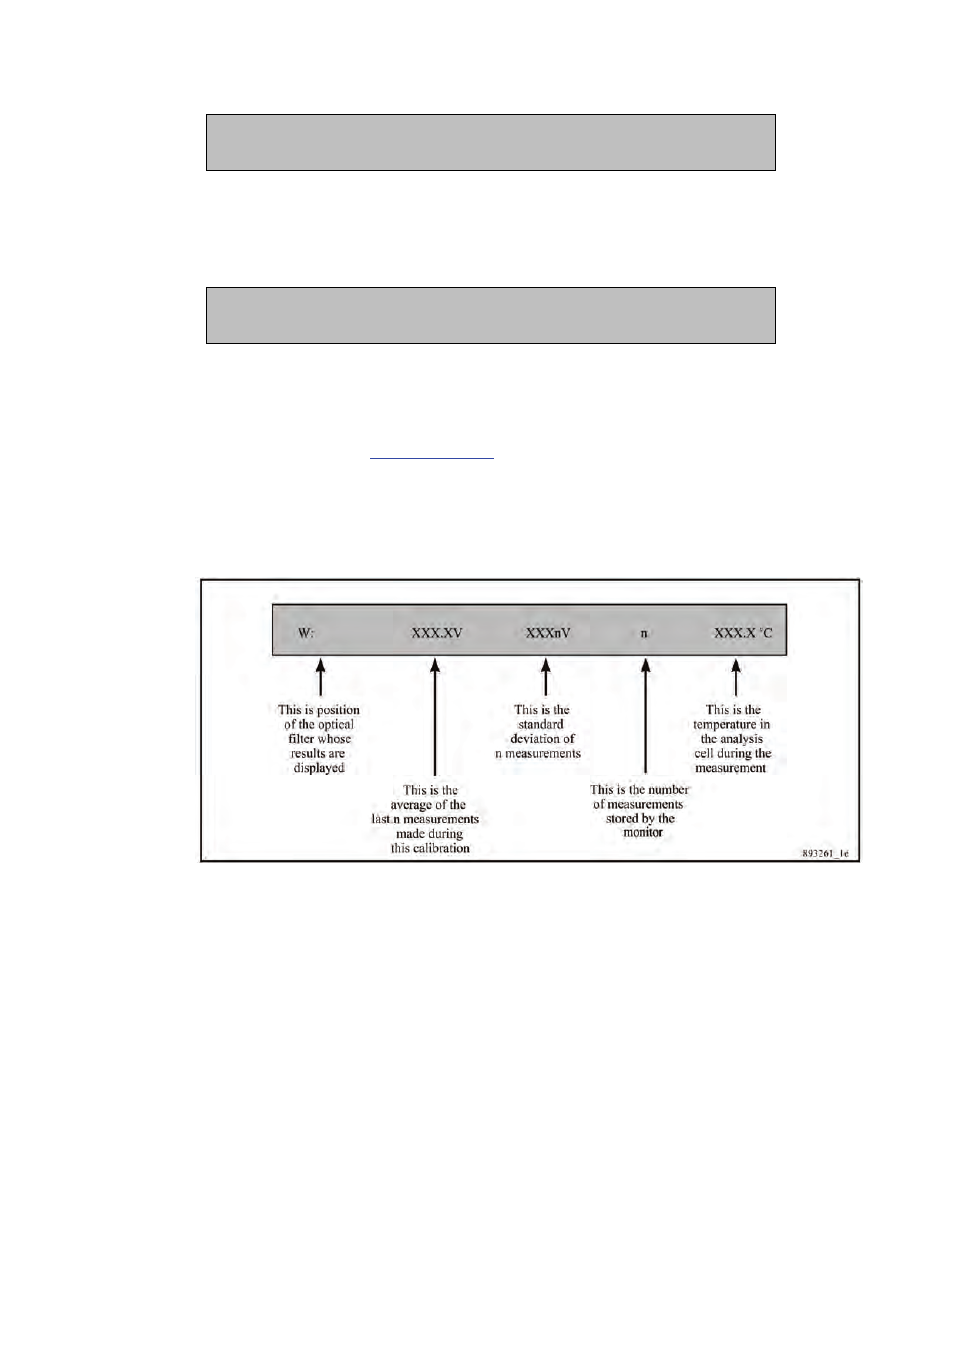
W: µ : 11.3µV σ --- V 1 38.6°C
PRESS ENTER WHEN RESULTS ARE STABLE
As soon as measurement results are available they not only
appear on the display (see Fig.12.12) but are automatically
printed out on the printer, if the Monitor has been set up to print a
data log, see
. Remember to turn off the data log
when the calibration is complete.
Fig.12.12 Example of data displayed during a calibration (the text
below the display describes the displayed data)
Each time a sample of gas is drawn into the analysis cell the
signal is measured using all the installed optical filters and the
water-vapour filter (“W”) but, due to lack of space on the display,
the Monitor only displays the signal measured using the water-
vapour filter. You cannot scroll through the measurements. The
data-log print-out, however, shows the signal measured using all
installed filters as well as the water-vapour filter.
A maximum of 6 measurements are stored in the Monitor during
any calibration. The number (n) indicates how many
measurements are stored. When 7 measurements have been
performed the number (n) will show the number 6 because the
very first measurement is overwritten by the 7
th
measurement so
that only 6 measurements are still stored. When 8 measurements