18 show metrics in the bus utilization window – Teledyne LeCroy Summit T24 PCIe Multi-lane Protocol Analyzer User Manual User Manual
Page 209
Summit T24 PCI Express Multi‐Lane Protocol Analyzer User Manual
197
Show Metrics in the Bus Utilization Window
Teledyne LeCroy
10.18 Show Metrics in the Bus Utilization Window
The Bus Utilization window provides graphs for packet‐level information in the
CATC Trace. The window also provides graphs for information on Split and Link
Transaction levels, plotted over time. The graphs for Split and Link Transaction levels are
based on metrics collected for the transactions throughout the CATC Trace.
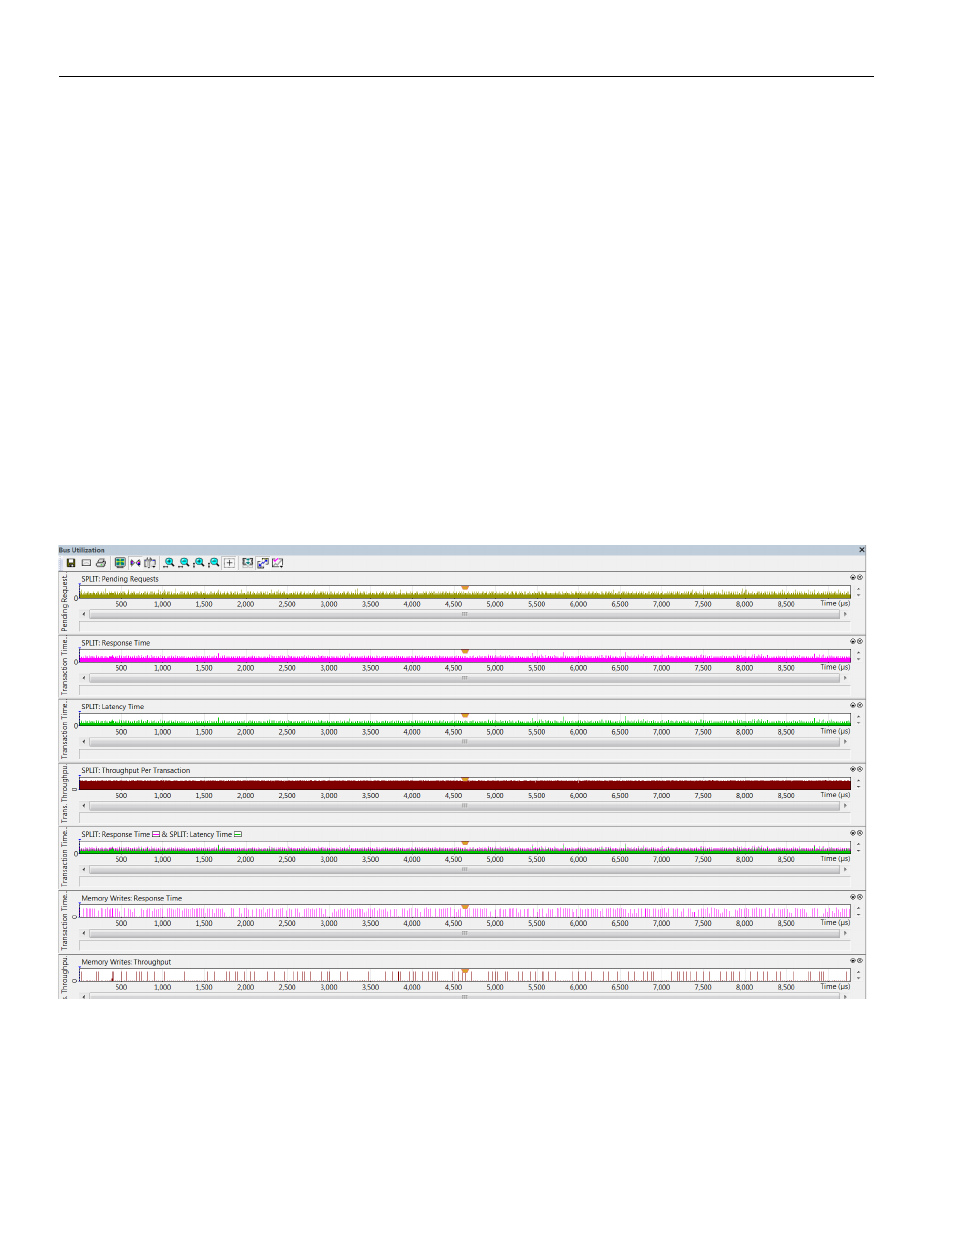
The seven graphs related to Split and Transaction levels are:
1. Pending Requests at Split Transaction level.
2. Response Time at Split Transaction level.
3. Latency Time at Split Transaction level.
4. Throughput Per Transaction at Split Transaction level.
5. Response Time and Latency Time at Split Transaction level (combined graph).
6. Response Time at Link Transaction level, for Memory Writes only.
7. Throughput at Link Transaction level, for Memory Writes only.
The following is an example of Bus Utilization window display of graph numbers 1, 4, 5, 6
and 7: