Strip chart configure time control, Splicing spectral data – Ocean Optics Ocean View Install User Manual
Page 65
4: Wizards
000-20000-310-02-201312
57
b. You may choose to display the average result from a range of wavelengths by selecting
Average from. When you select this option, two boxes become active. These boxes
represent the lower and upper wavelength values over which OceanView will compute an
average value.
--OR--
c. You may also choose to display the integrated result over a range of wavelengths by
selecting Integrate over. When you select this option, three boxes become active. The
top two boxes represent the lower and upper wavelength bounds over which OceanView
will compute an integral. The last box allows you to set the integration method. You may
choose between Rectangular, Trapezoidal, or Simpson’s Rule.
The Strip Chart offers the same functionality available with the Graph View Controls with the addition of
the Strip Chart Configure Time Control.
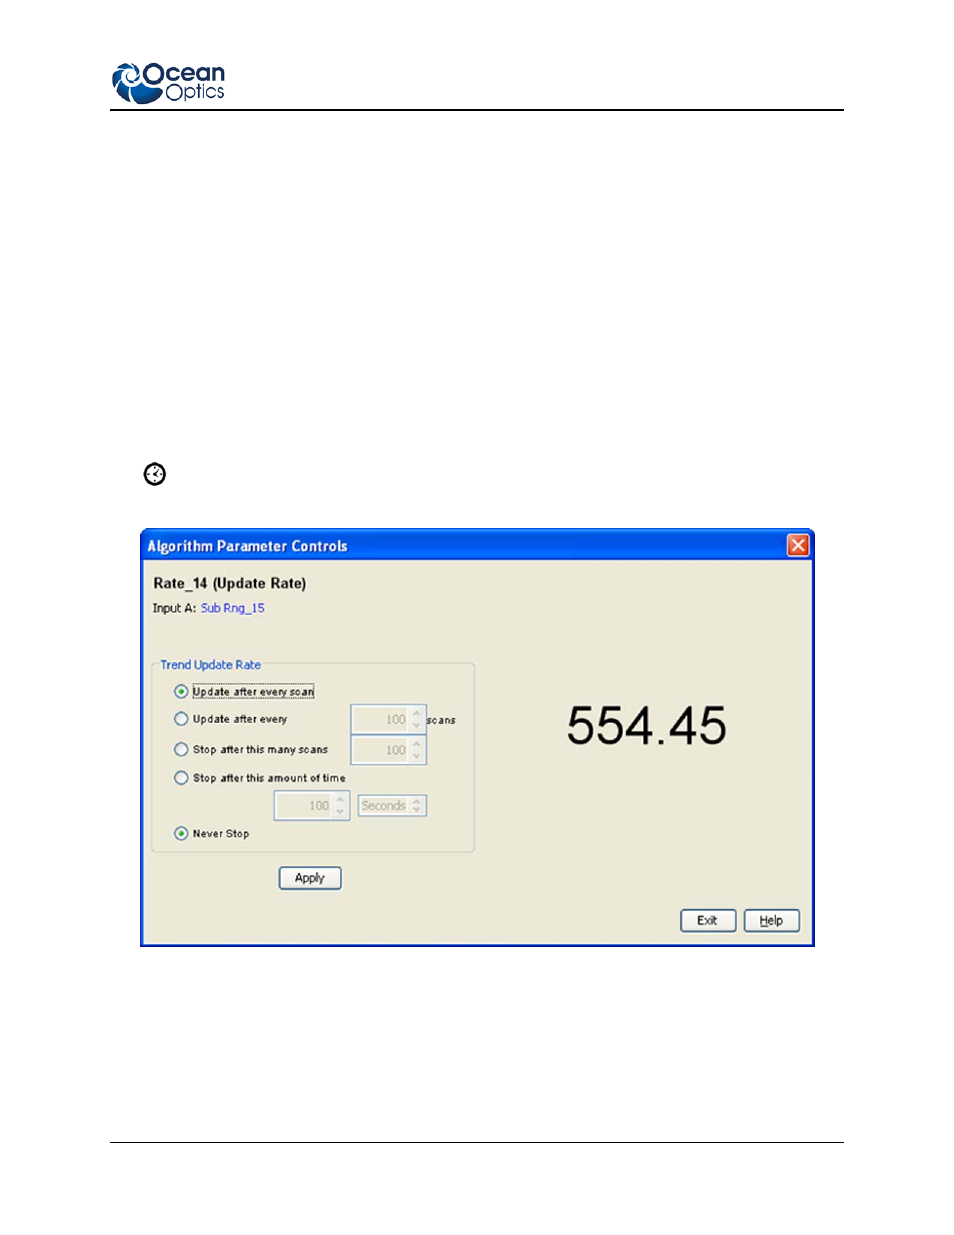
Strip Chart Configure Time Control
The
control on the Strip Chart displays the Algorithm Parameter Controls dialog box, which allows
you to adjust the trend update rate.
Splicing Spectral Data
OceanView has a post-processing mode that allows you to splice spectral data from multiple
spectrometers into a single spectrum. Note that spectral splicing can only be done with processed spectra:
Absorbance, Reflection, Transmission, Relative Irradiance or Absolute Irradiance.