Configure graph saving – Ocean Optics Ocean View Install User Manual
Page 35
3: User Interface
000-20000-310-02-201312
27
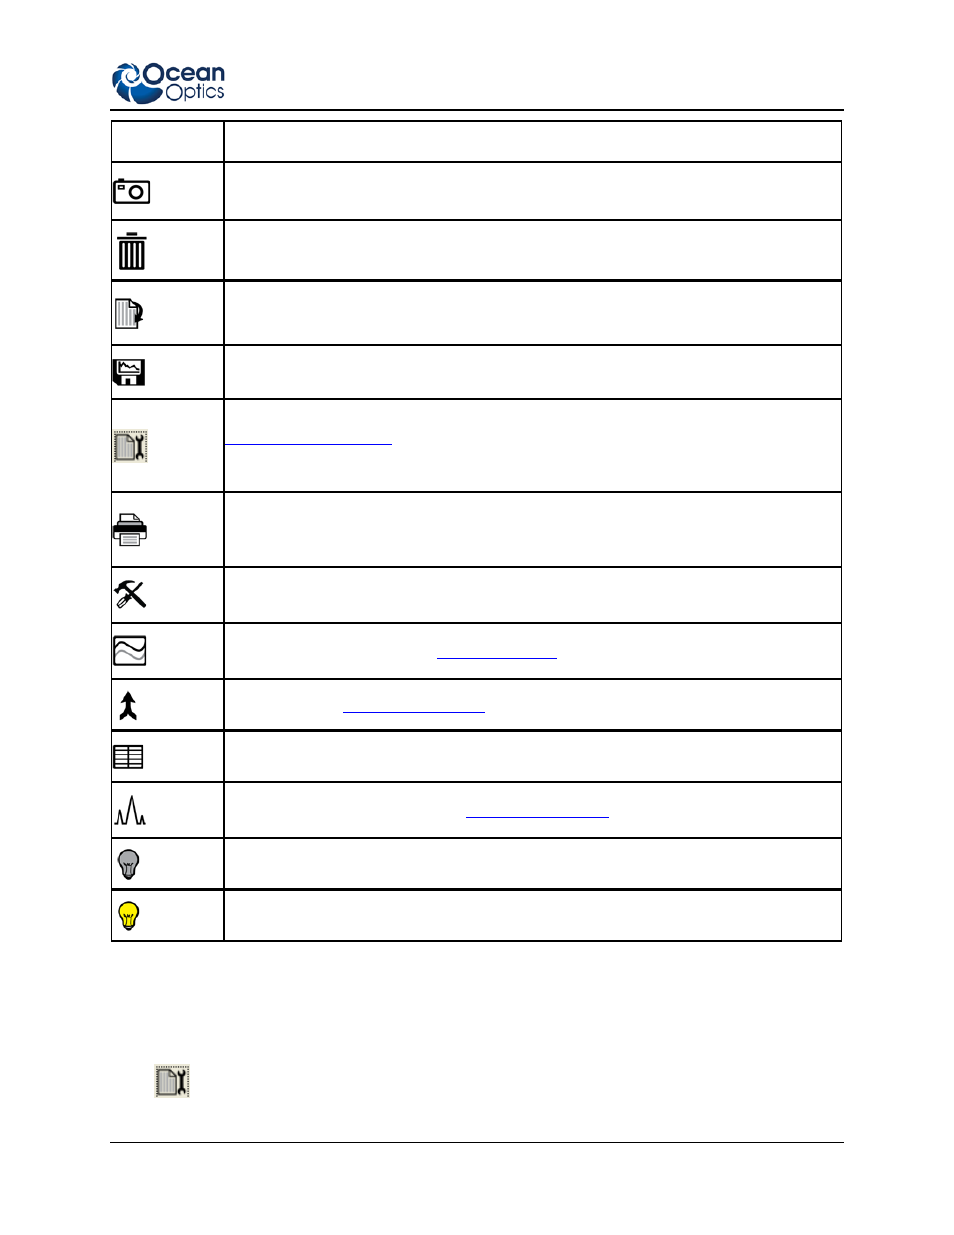
Control
Function
Convert active spectrum to overlay. Takes a snapshot of the currently displayed
spectrum and overlays it on the graph. Each graph line displays in a different color.
Delete overlay spectrum. Removes an overlaid spectrum from the graph.
Copy data to clipboard. Copies spectral data to your computer's clipboard.
Save graph to file. Saves your data as a text file.
Save content over time to one or multiple files (depending on how it is configured). See
. When combined with external triggering, this feature can be
used to automatically save full spectra timed to one or more external events. After this is
selected once, press the spacebar for additional saves.
Print graph. Prints the spectrum graph. Displays the Print Spectrum Dialog Box to set
print options. You can enter a title and notes for your graph and select their font size, as
well as adjust the width of the x and y gridlines.
Set graph layer options. Displays the Graph Layer Options window.
Create strip chart. Invokes the
Splice data. See
View results in table form.
View spectrum peaks. Invokes the
Update background data for this acquisition
Update reference data for this acquisition
Configure Graph Saving
OceanView provides the capability of saving and exporting processed data for each graph view to an
ASCII file.
Click
to display the Algorithm Parameter Controls dialog box.