Figure a-7, Figure a-8, Sw plus 4048 efficiency curve – Xantrex Technology SW Plus 4024 User Manual
Page 269: Sw plus 5548 efficiency curve
Power Versus Efficiency
976-0043-01-02
A–11
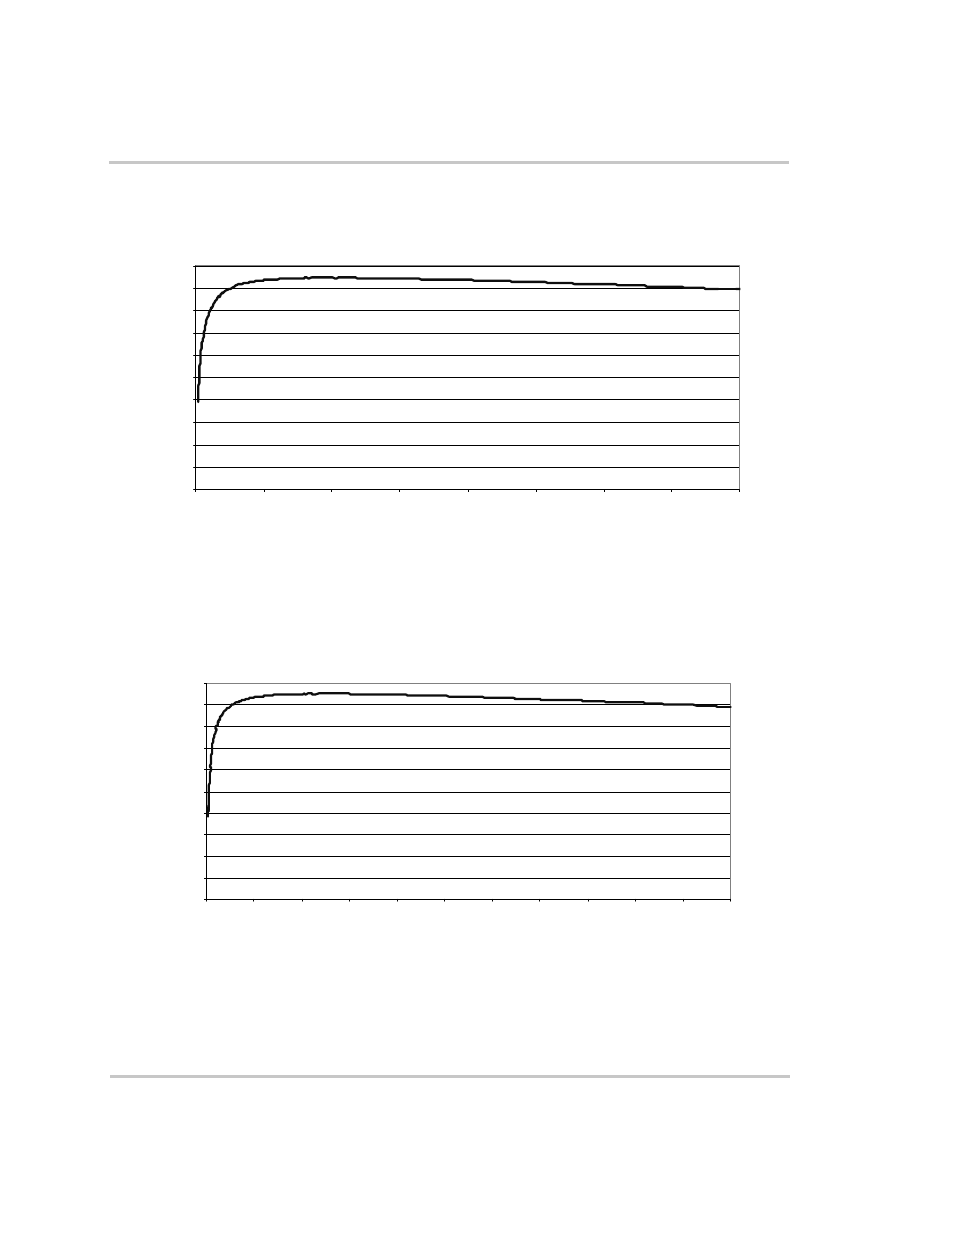
Figure A-7
Sine Wave Plus
Efficiency Curve for the SW Plus 4048
Figure A-8
Sine Wave Plus
Efficiency Curve for the SW Plus 5548
SW Plus 4048 Efficiency Curve
0%
10%
20%
30%
40%
50%
60%
70%
80%
90%
100%
0
500
1000
1500
2000
2500
3000
3500
4000
Output Pow er in Watts
E
ff
ici
en
c
y
M easurement s made using resistive load bank and Y okogawa PZ4000 Power A nalyzer
SW Plus 5548 Efficiency Curve
0%
10%
20%
30%
40%
50%
60%
70%
80%
90%
100%
0
500
1000
1500
2000
2500
3000
3500
4000
4500
5000
5500
Output Pow er in Watts
E
ff
icien
cy
M easurement s made using resist ive load bank and Yokogawa PZ4000 Power
Analyzer
This manual is related to the following products: