Figure a-3, Figure a-4, Sw plus 2524 efficiency curve – Xantrex Technology SW Plus 4024 User Manual
Page 267
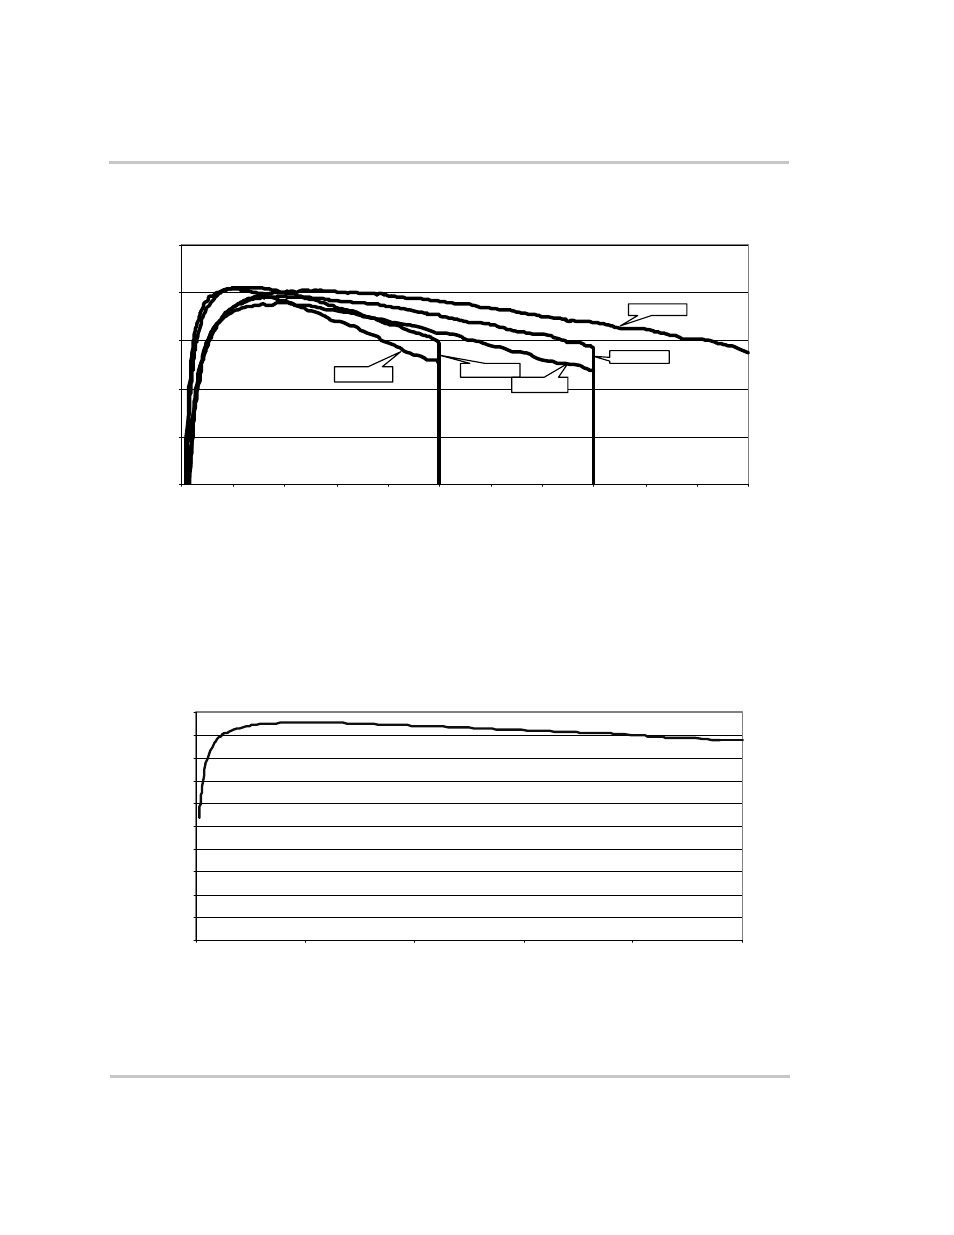
Power Versus Efficiency
976-0043-01-02
A–9
Figure A-4
Sine Wave Plus
Efficiency Curve for the SW Plus 2524
Figure A-3 Power Versus Efficiency Curves for All Models
SW Plus Efficiency Curves
75%
80%
85%
90%
95%
100%
0
500
1000
1500
2000
2500
3000
3500
4000
4500
5000
5500
Output Pow er in Watts
E
ff
ici
en
c
y
Measurement s made usi ng resist iv e load bank and Yokogawa WT2030 Digit al Power Met er or Yokogawa PZ4000 Power
Analy zer
SW Plus 2524
SW Plus 5548
SW Plus 2548
SW Plus 4024
SW Plus 4048
SW Plus 2524 Efficiency Curve
0%
10%
20%
30%
40%
50%
60%
70%
80%
90%
100%
0
500
1000
1500
2000
2500
Output Pow er in Watts
E
ff
ici
ency
M easurements made using resistive load bank and Y okogawa WT 2030 Digit al Power M eter
This manual is related to the following products: