Viewing vital signs, Viewing vital signs -9 – Philips V24CT User Manual
Page 247
Viewing Patient Data
Trends and Calculations 8-9
Tr
e
nds
a
nd
C
a
lcula
ti
o
n
s
Viewing
Vital Signs
Patient data can be shown in a table three minutes after monitoring
begins. The table appears in the default data time interval (1-min., 5-min.,
15-min., 1-hr., 2-hrs., or 3-hrs.) with the most recent data at the right of the
screen. The number of hours of patient data available (maximum 24 hours
or 48 hours (CMS only)) depends on the patient data management
configuration of the monitor and the options purchased.
The values shown are for the exact time they are labelled (they are the
stored averaged value of readings taken every 12 seconds for a one-
minute interval; in 12-second mode, only one 12-second sample is shown
for each minute).
A “?” beside a value indicates that the data for that time may not be
reliable. For example, when the message “NOISY SIGNAL” appears on the
screen, it often causes a “?” to appear as the HR numeric. If the “?”
appears in the HR area for 3 out of the 5 samples taken in a minute, the
value stored for that minute will be “?”.
If a “?” appears, adjust the parameter settings so that they are appropriate
for your patient. (This is done in the parameter's Task Window.) Check to
be sure that any patient cables, leads or tubing are not being pulled, and
that the patient is not lying on them.
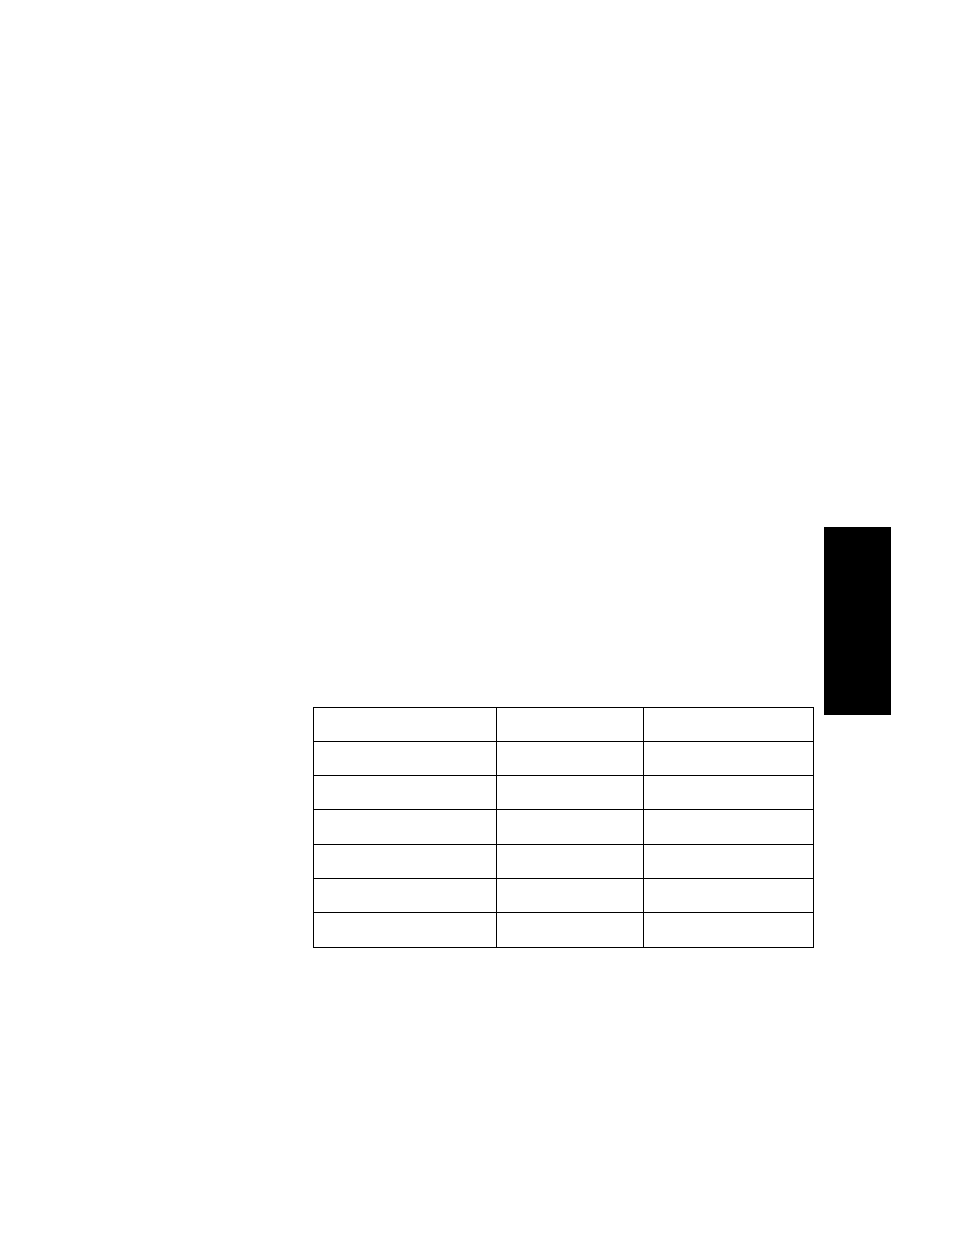
When you go directly between Graphs and Vital Signs Task Windows to
view data in a different format, the mapping is as follows:
Vital Signs Interval
Direction
Graph Trends Span
1-minute
-->
1 hour
5-minute
<--
1 hour
15-minute <--> 2
hours
1-hour
<-->
8 hours
2-hour
<-->
16 hours
3-hour
-->
24 hours