Philips V24CT User Manual
Page 242
Viewing Patient Data
8-4 Trends and Calculations
Tr
e
nds
a
nd
Calcula
tion
s
Extended Database (CMS only)
If data is stored every minute, the values displayed are the stored
averaged values of samples taken every 12 seconds for a one-minute
interval (5 samples per minute). If data is stored every 12 seconds, the
values displayed are the exact values taken at one of the 12-second
intervals.
For example, if the database has been configured for 4 hours, typical of
the OR, the data values appear at 12 second intervals. In this case, the
values are exactly as measured, not averaged.
An asterisk on the trend or graph (*) indicates (1) a manually entered
value, (2) a resampled continuously monitored value from the last
second, or (3) a value more than 10 minutes old at the time of
resampling.
Note—
When the time in the upper right corner of the Graph Trends Task
Window matches the system time (time bar at rightmost position on
trend), the screen will be updated as new data is acquired. The Vital
Signs display does not update automatically when new data becomes
available. To see new data, use the right arrow key
.
Printed copies of the displayed data can be made (if a printer is
available) by pressing the
key in the Vital Signs display,
the
key in the Blood Review display, or the
in the Graph Trends.
Trended vital signs can be recorded (if an M1116B PLUG-IN Recorder is
available) by selecting “Vitals PLUG-IN” in the Vital Signs task window.
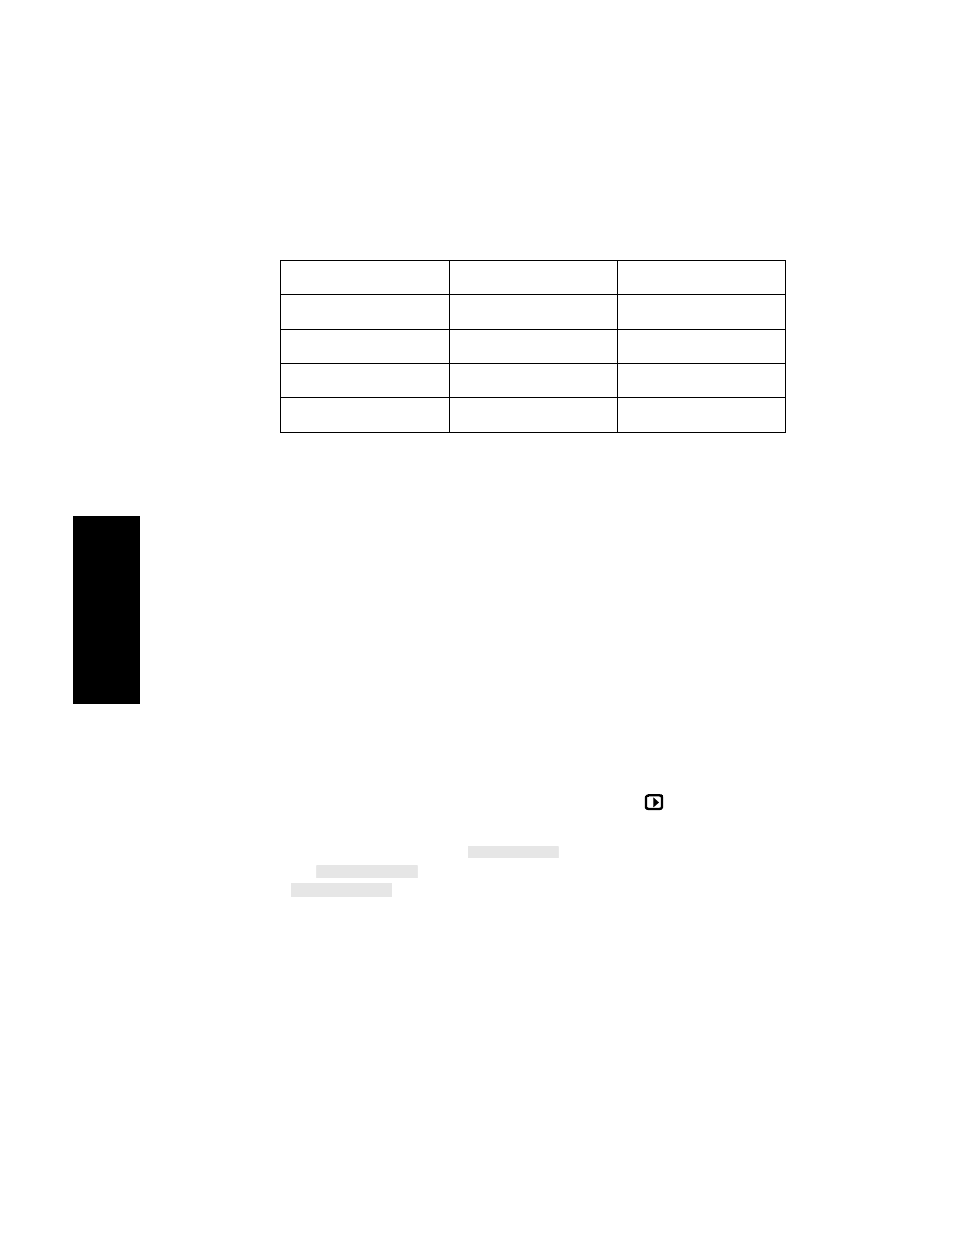
No. of Parameters
Resolution
Size
16
12 seconds
9 hours
16
1 minute
48 hours
32
12 seconds
4 hours
32
1 minute
24 hours
Print Vitals
Print Review
Print Graphs