3 chart display, Chart display – SMA Sunny Data Control V.5.0 User Manual
Page 122
Transferring Data to the Internet
SMA Technologie AG
124
SDC-TEN081450
Technical Description
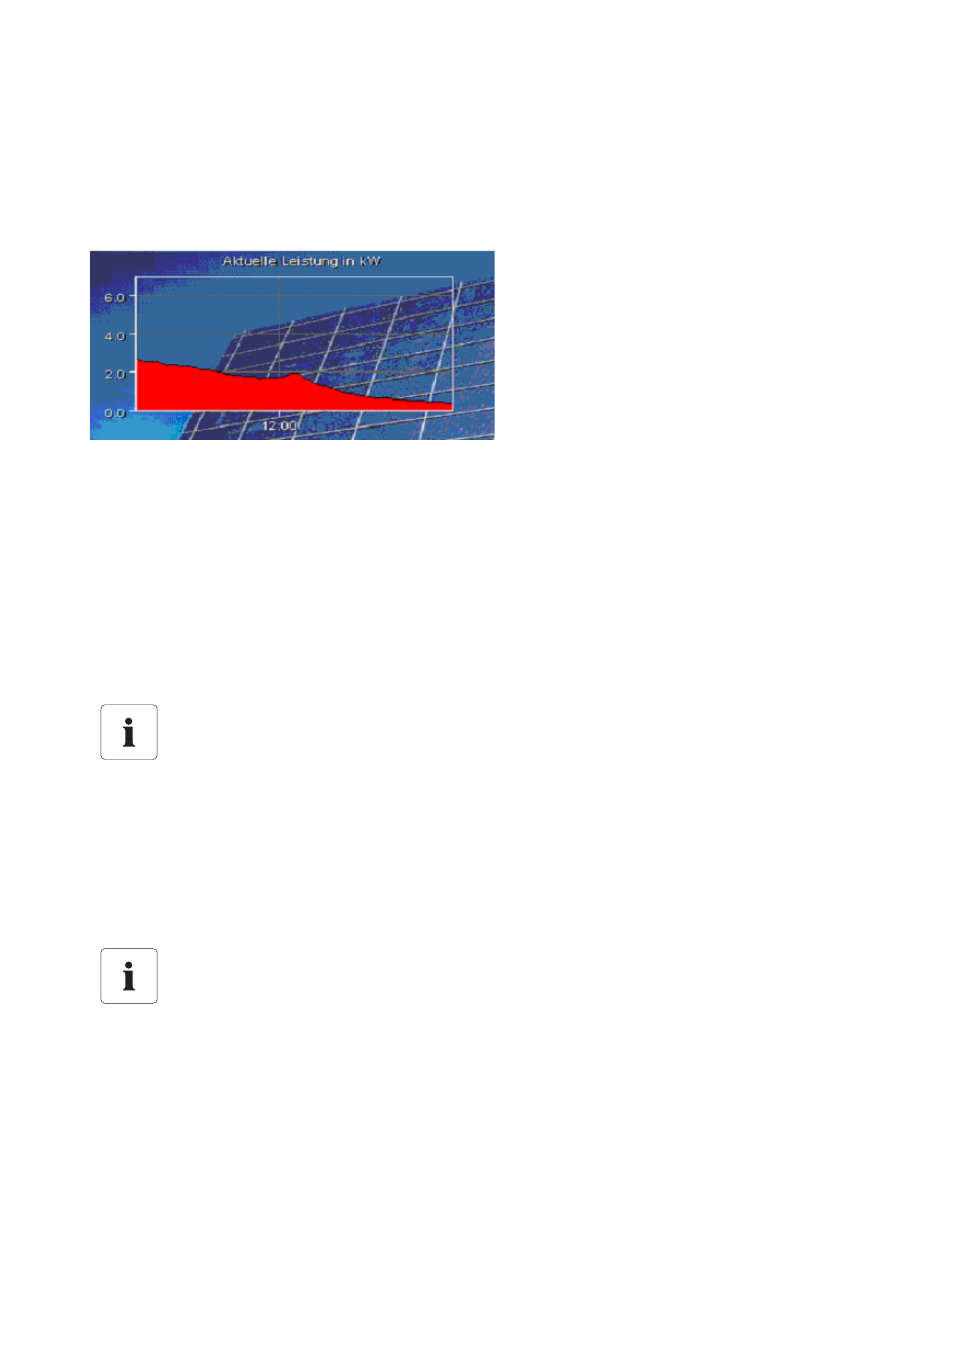
12.8. 3 Chart Display
With the aid of this component, channel values are displayed as a chart. Here, the values of the
channel are applied to a Cartesian coordinate system as points, and interconnected by a line. As
an option, the area beneath the line can be filled in.
Any text can be displayed as the title, centered within the display. This is also optional.
The display's legend serves to label the individual channel curves. This indicates the name, the unit
in brackets, and the color of each respective channel.
The labeling of the X and Y axes is generated automatically. The maximum value for the Y axis is
based on the largest value of one of the displayed channels, and is always displayed with one
decimal place. The X axis represents time.
In order to show "chart display" components, the type "de.sma.SunnyViewer.ViewerDiagram“ must
be entered in parameter "Component1".
The other parameters of this component type are listed below.
AxisColor (Color)
Defines the color of the actual X and Y axes. By default, this optional parameter is set to black.
Example
Example
Sets the color of the axes to white.