Super Systems 9205 Series User Manual
Page 18
Series 9205 Operations Manual Rev A
17
The folder button -
-
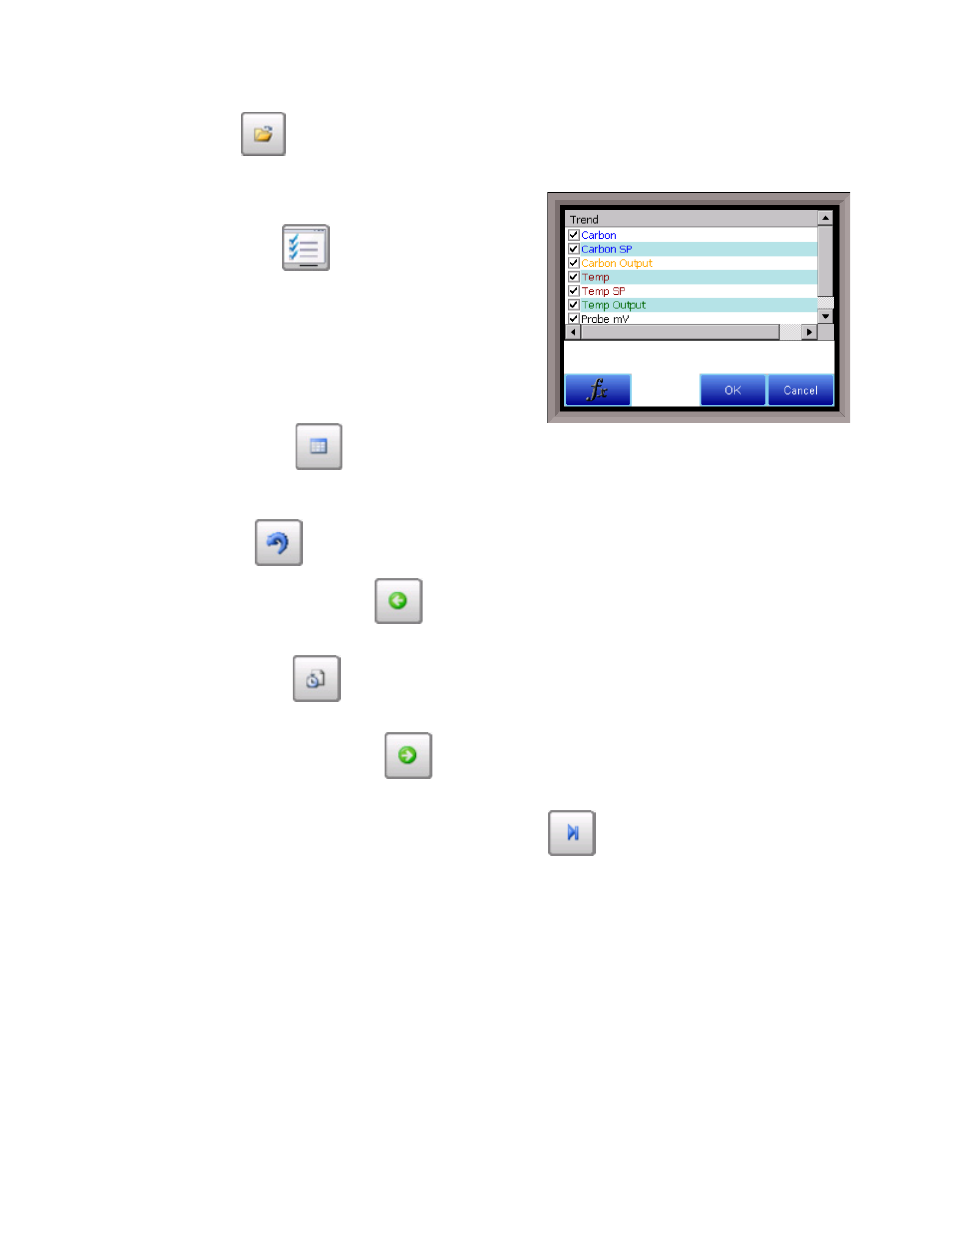
The Trend Lines button -
- will allow the user to
select or de-select the trend lines on the trend chart to
display. If the checkbox next to each trend line is checked,
then that trend line will be displayed.
`
The Datagrid View button -
- will display a screen with
the trend data in a grid format instead of with trend lines. The trend data is shown in 1-minute intervals.
Clicking on the OK button on this screen will close the screen down and return to the Chart Display screen.
The Refresh button -
- will refresh the screen’s trend data if the screen is not in real-time mode.
The left-pointing green arrow button -
- will move the chart’s view backward in time by the
specified chart interval.
The chart interval button -
- will determine the number of hours displayed on the trend chart. The
options are: 1 Hour, 2 Hours, 4 Hours, 8 Hours, 12 Hours, or 24 Hours.
The right-pointing green arrow button -
- will move the chart’s view forward in time by the specified
chart interval.
The right-pointing arrow with the vertical line next to it button -
- will put the chart into real-time
mode if it is not in real-time mode, or take the chart out of real-time mode if it is. When in real-time mode,
the chart will automatically be updated once a minute.