Nu…… lv-54, Bar graph meters…… lv-54 analog meters…… lv-54, Indicators menu – Measurement Computing LogBook Series User Manual
Page 180
LV-54 LogView
989592
Software
Reference
Indicators Menu
Bar Graph Meters
Analog Meters
Digital Meters
Enable Input Reading Column
Start All Indicators
Stop All Indicators
Along with displaying channel data in real time in the setup spreadsheets, LogView also
provides auxiliary real-time indicators.
The meter windows simulate the look of popular meter types: the bar graph, the analog
dial, and the digital readout. Within each meter type, you can adjust their display
properties to fit your needs. Such properties include number of channels, high/low
limits, peak hold, trend indicator, etc.
Next, each meter type is shown; and then, their configuration is discussed (they all work
in a similar way).
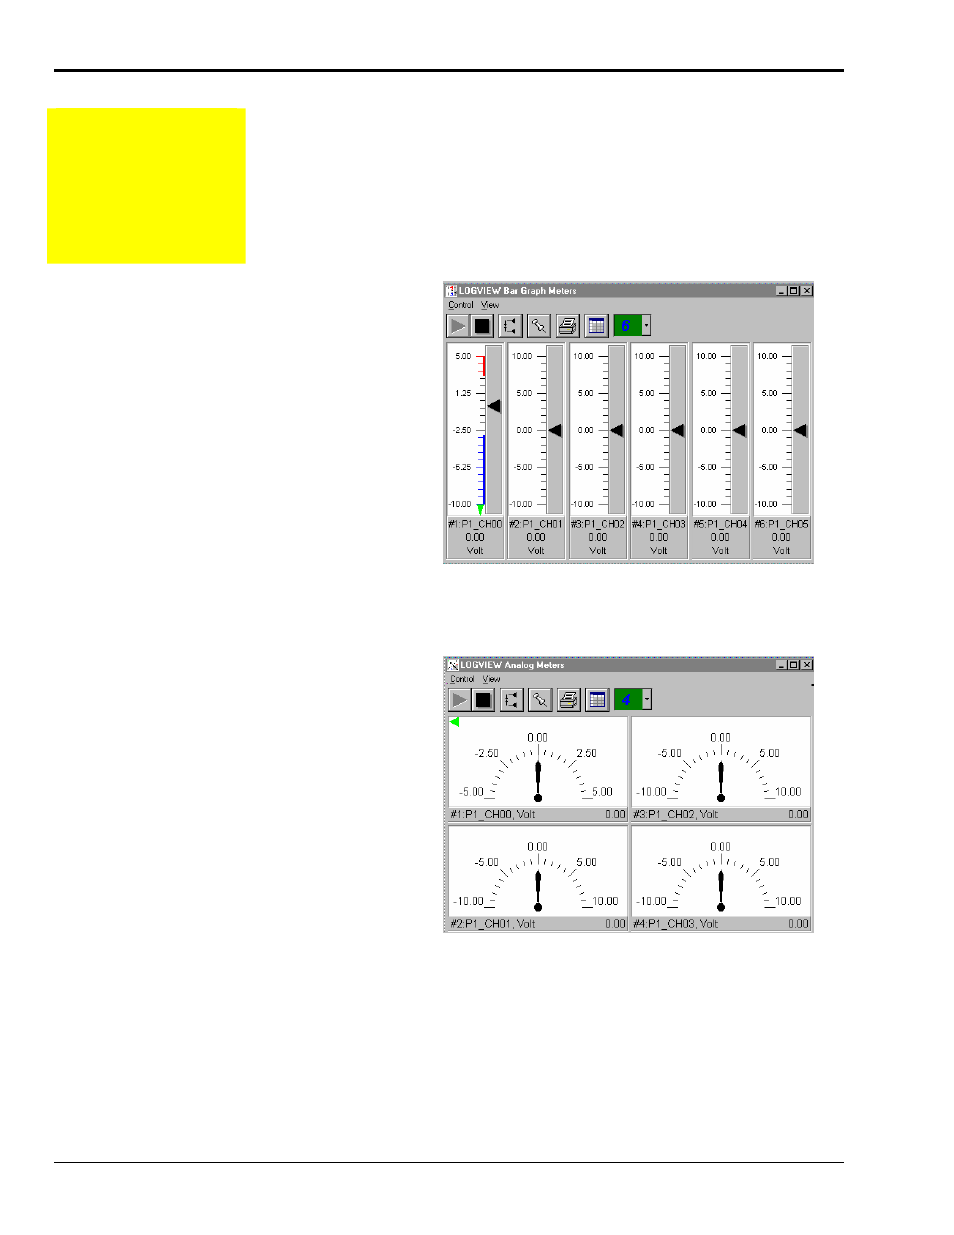
Bar Graph
Meters
(no toolbar
icon)
Selecting the Bar Graph Meter icon
brings up the Bar Graph window to
display several channels in bar graph
format. To activate the display, select
the
toolbar (or Start All Indicators in the
pull-down menu or in the toolbar). You
can vary the number of channels
(32 max) displayed by selecting the
input box at the end of the toolbar. The
toolbar) is used to arrange the display
for convenient reading. The pushpin
icon in the center of the toolbar locks
this window on top of other windows
until you unlock it by selecting the
pushpin again.
Analog
Meters
(no toolbar
icon)
Selecting the Analog Meter icon brings
up the Analog Meters window to display
several channels in a dial/gage format.
To activate the display, select the
toolbar (or Start All Indicators in the
pull-down menu or in the toolbar). You
can vary the number of channels (32
max) displayed by selecting the input
box at the end of the toolbar. The
toolbar) is used to arrange the display
for convenient reading. The pushpin
icon in the center of the toolbar locks
this window on top of other windows
until you unlock it by selecting the
pushpin again.