Pitney Bowes MapInfo Vertical Mapper User Manual
Page 97
Chapter 6: Working with Grids
User Guide
95
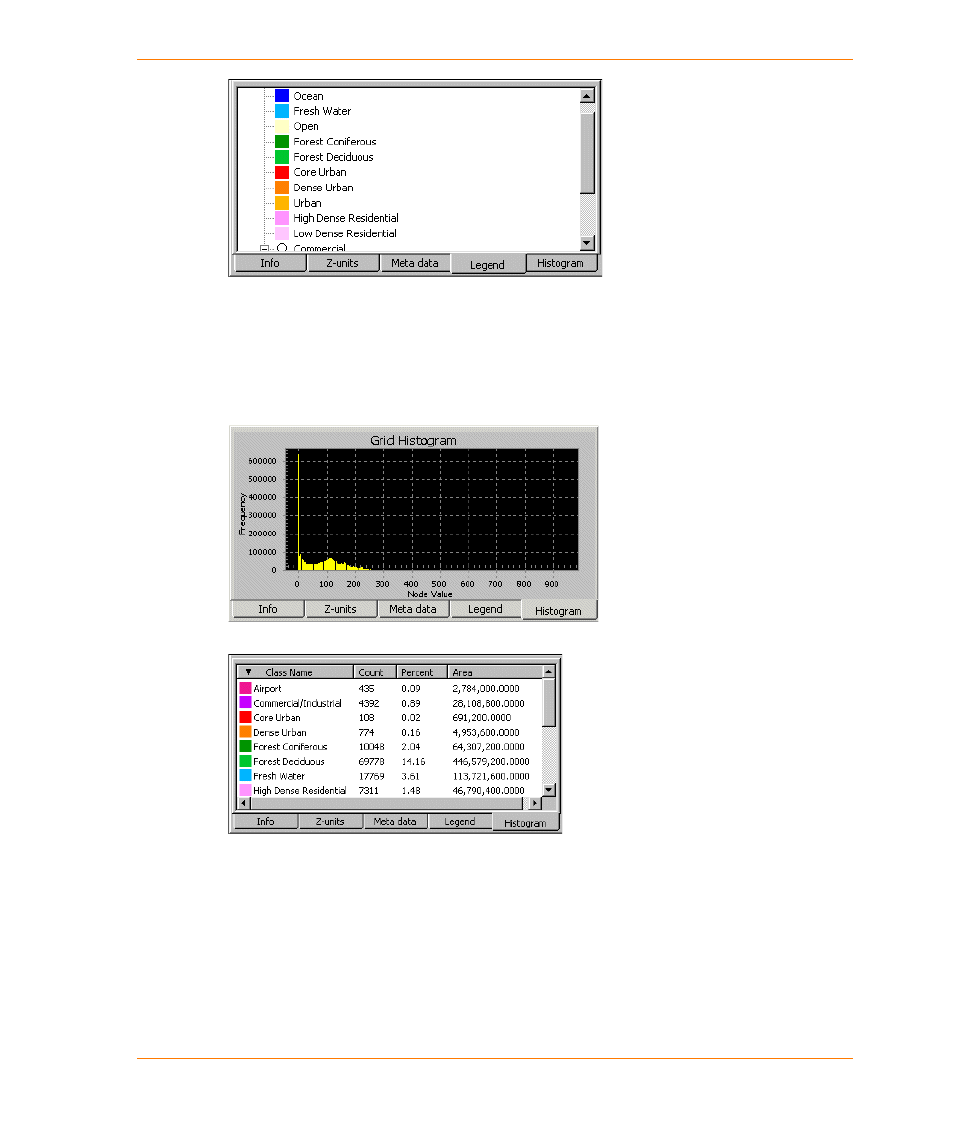
Legend for a classified grid.
The Histogram tab displays a histogram of the grid data in a graph window. The histogram provides
you with a visual display of the distribution of your data so that you can make better decisions for
grid display and grid analysis operations. This window can also display classified grid data by class
name, class count, percentage, and area. You can customize the display of the histogram by right-
clicking on the histogram.
Histogram for a numeric grid
Histogram for a classified grid