Pitney Bowes MapInfo Vertical Mapper User Manual
Page 64
Understanding the Location Profiler Model
62
Vertical Mapper 3.7
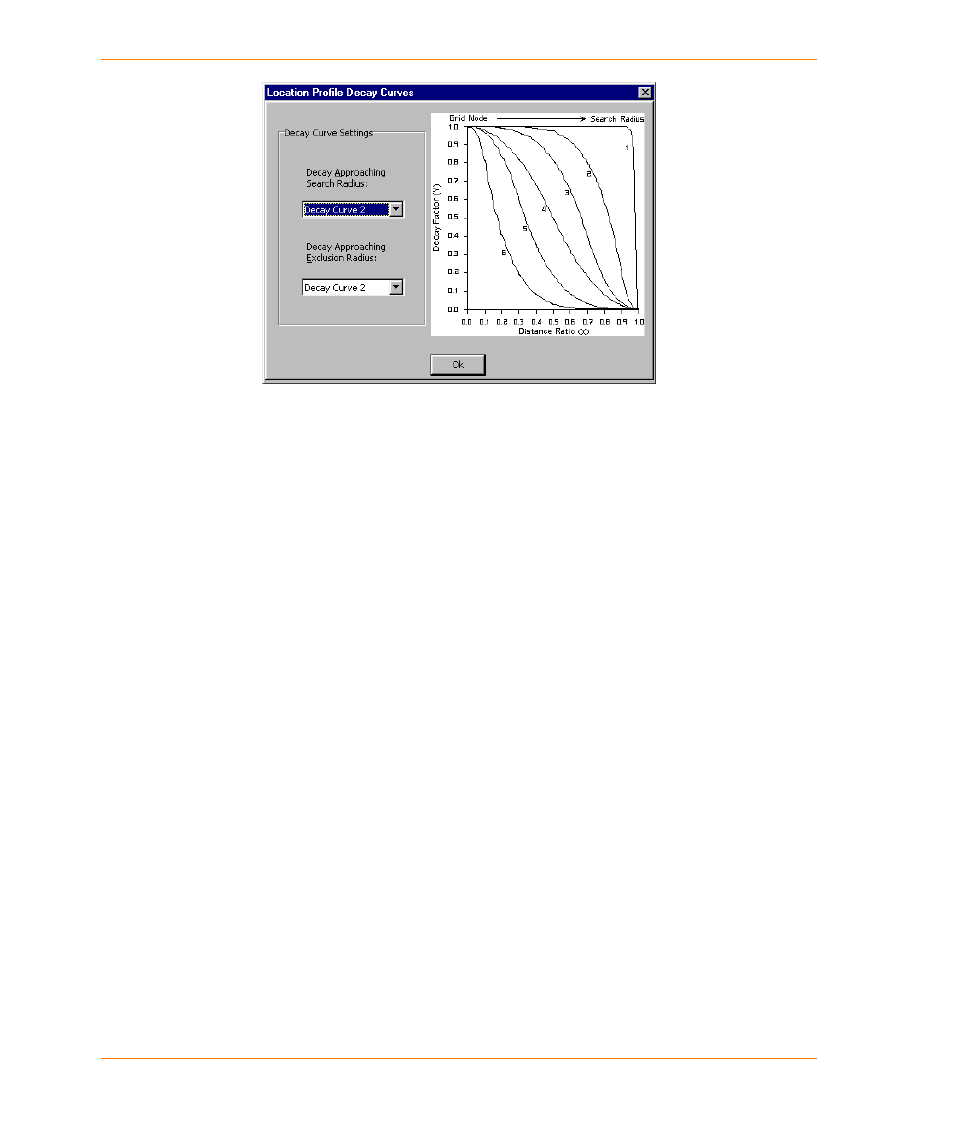
The Decay Approaching Search Radius list enables you to choose one of the supported curves
from the list for the calculation. Each decay function defines a smooth curve with a negative slope
that always starts at coordinate (0, 1) with a slope of zero and always ends at coordinate (1, 0) with
a slope of zero. The coordinates of the inflection point (where the slope of the curve either stops
increasing in value or stops decreasing in value) and the slope at this point is recorded for each
function.
•
Decay Curve 1 defined by an inflection point at (.99, .01) having a slope of -99.
•
Decay Curve 2 defined by an inflection point at (.9, .2) having a slope of -5.
•
Decay Curve 3 defined by an inflection point at (.7, .4) having a slope of -3.
•
Decay Curve 4 defined by an inflection point at (.5, .5) having a slope of -2.
•
Decay Curve 5 defined by an inflection point at (.3, .6) having a slope of -3.
•
Decay Curve 6 defined by an inflection point at (.1, .8) having a slope of -5.
The Decay Approaching Exclusion Radius list enables you to choose one of the supported
curves from the list for the calculation. Each decay function defines a smooth curve with a positive
slope that always starts at coordinate (1, 0) with a slope of zero and always ends at coordinate (1, 1)
with a slope of zero. The coordinates of the inflection point and the slope of the curve at this point
are recorded for each function.
•
Decay Curve 1 defined by an inflection point at (.01, .01) having a slope of 99.
•
Decay Curve 2 defined by an inflection point at (.05, .4) having a slope of 20.
•
Decay Curve 3 defined by an inflection point at (.05, .1) having a slope of 10.
•
Decay Curve 4 defined by an inflection point at (.1, .2) having a slope of 5.
•
Decay Curve 5 defined by an inflection point at (.3, .4) having a slope of 3.
•
Decay Curve 6 defined by an inflection point at (.5, .5) having a slope of 2
Note If none of the curves provided describes the decay characteristics of your data, create a
curve by editing the vmxclude.cfg or the vmweight.cfg file located in the All Users\Application
Data\MapInfo\MapInfo\Vrtical Mapper\350 folder.