Modifying directional parameters – Pitney Bowes MapInfo Vertical Mapper User Manual
Page 160
158
Vertical Mapper 3.7
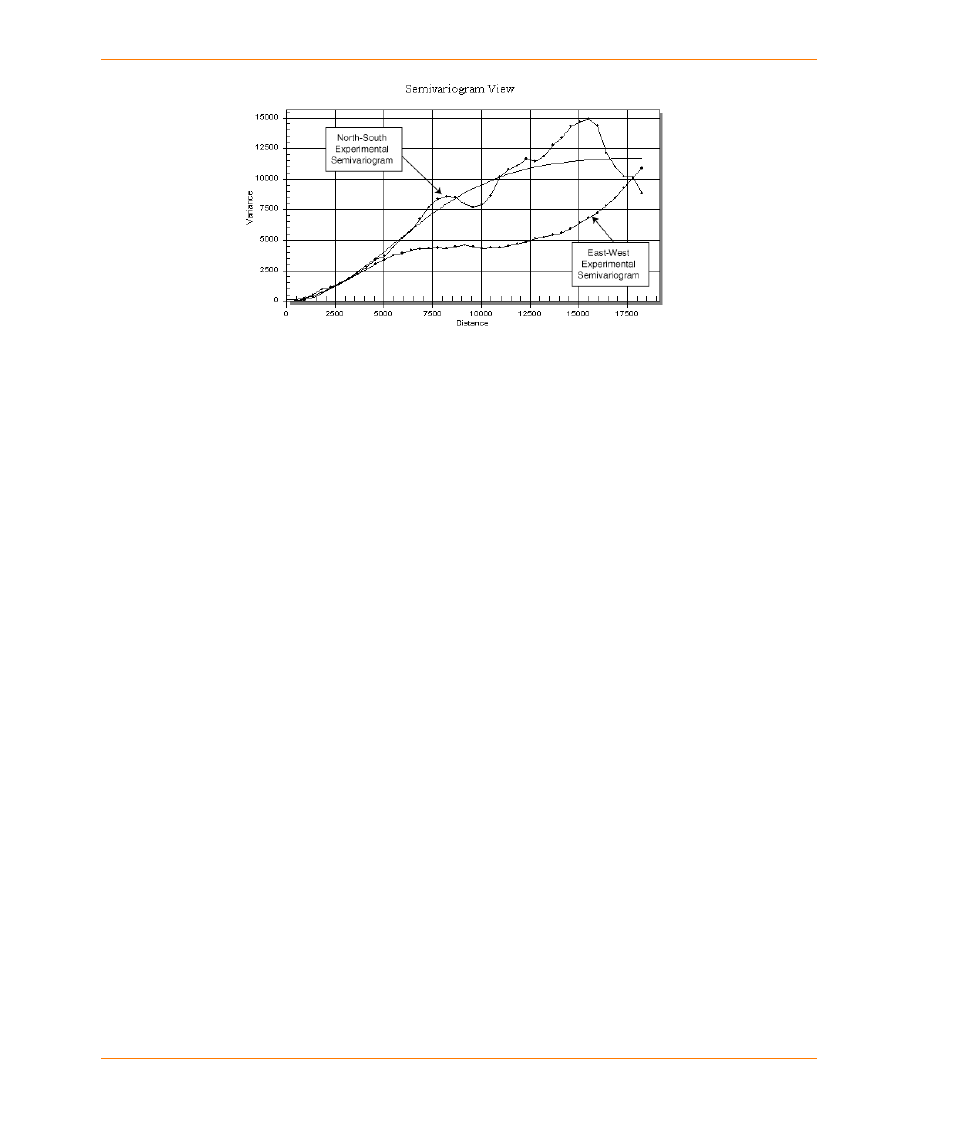
An example of a directional semivariogram. Notice the two experimental
semivariograms, one representing points oriented north and south of each other, and
the other representing points oriented east and west of each other.
When two or more directions are analyzed, an experimental semivariogram will be generated for
each direction. In the previous figure, two directions are being investigated and therefore two
experimental semivariograms are plotted.
Semivariogram experimentation can uncover fundamental information about the data, such as
whether the data varies in more than one direction. In more technical terms, the semivariogram
experimentation can reveal whether the data is isotropic (the data varies the same in all directions)
or anisotropic (the data varies differently in different directions) as demonstrated in in the previous
figure.
When investigating these directional trends, you will have to modify parameters such as the
directions in which the variances will be calculated. These parameters are discussed in the following
section.
Modifying Directional Parameters
Up to this point the directional calculation of variance has been discussed as being north-south and
east-west. In reality, data will not have directional variations that are described in these exact
directions. Therefore, you will need to create a model that “looks” in the direction in which the data is
varying. This is done by modifying the number of different directions analyzed, the angle in which
they are oriented, and the degree of tolerance that will be afforded to each direction.