Significance analysis – Pitney Bowes MapInfo Vertical Mapper User Manual
Page 167
Chapter 9: Data Analysis
User Guide
165
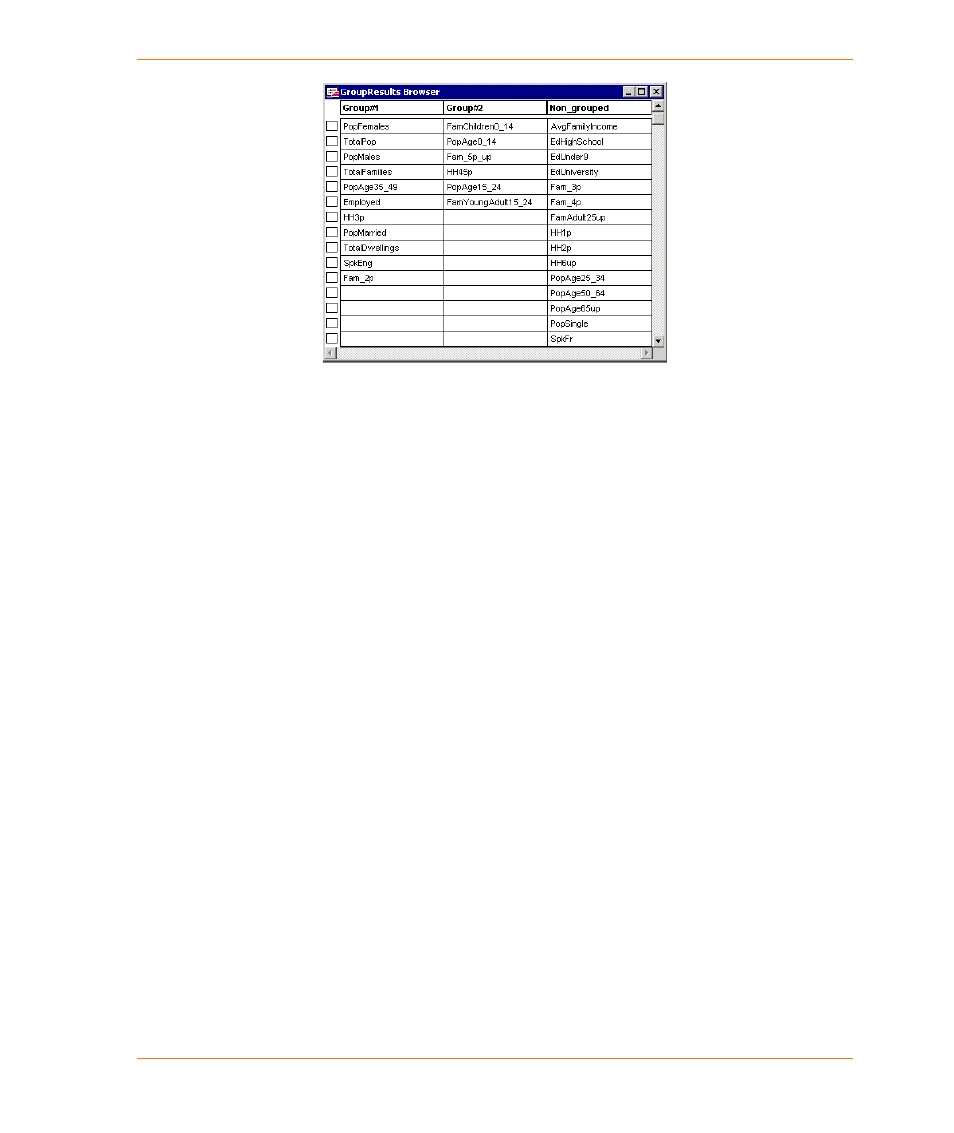
In this example, the specified group similarity was 0.7. The members in Group #1 and
Group #2 have a correlation coefficient among themselves of 0.7 or higher.
Significance Analysis
Significance analysis enables you to determine quickly which grids are the most significant by
displaying the names of grids that have a weight factor of at least the value you specify. Significance
analysis is particularly useful when you have large numbers of grids. It would be possible to achieve
the same results manually by creating a component analysis and picking out the grids with the
appropriate weights. For more information about principal components analysis, see
Components Analysis on page 166
1. From the Vertical Mapper menu, choose the Data Analysis > Spatial Correlation >
Significance Analysis command.
2. In the Significance Analysis dialog box, clear any open grids you do not want to include in the
analysis.
3. In the Significance Weight box, enter the minimum weight factor the grids must have to be
included.
4. Click the OK button. A Browser opens displaying the name of all the grids with at least the
specified weight factor.