Using the line info tool, Using colour in grids, Using the line info tool using colour in grids – Pitney Bowes MapInfo Vertical Mapper User Manual
Page 100: Information, see
Using the Line Info Tool
98
Vertical Mapper 3.7
Using the Line Info Tool
The Line Info tool displays a statistical summary of the data along a selected line. The values
displayed are for the grid highlighted in the Grid Manager. To display information for a large number
of lines contained in the same table, use the Line inspection tool. For more information about line
inspection, see
The Line Inspection Function on page 130
.
1. On the Vertical Mapper toolbar, click the Line Info button
.
2. Click on a line in the Map window.
Note The number of samples taken along the line is determined by the Cross Section: No of
Samples parameter in the Preferences settings. The default is 100. To change this value,
choose the Vertical Mapper > Preferences command and enter a new number in the No. of
Samples box. For more information about preferences, see
.
You can choose whether or not values are interpolated within cells by enabling or clearing the
check box on the z-units tab in the Grid Manager. For more information, see
Using Colour in Grids
The use of colour is an effective way to give meaning to large stores of data. The display of grid data
in Vertical Mapper is achieved by assigning a range of colour values, defined by a series of colour
inflection points, to each grid cell based on the numeric or character value assigned to it.
For numeric grids, the colour inflection points are carried in the header portion of the grid file and can
be easily modified using the Grid Colour Tool, which is a powerful tool used to present data visually.
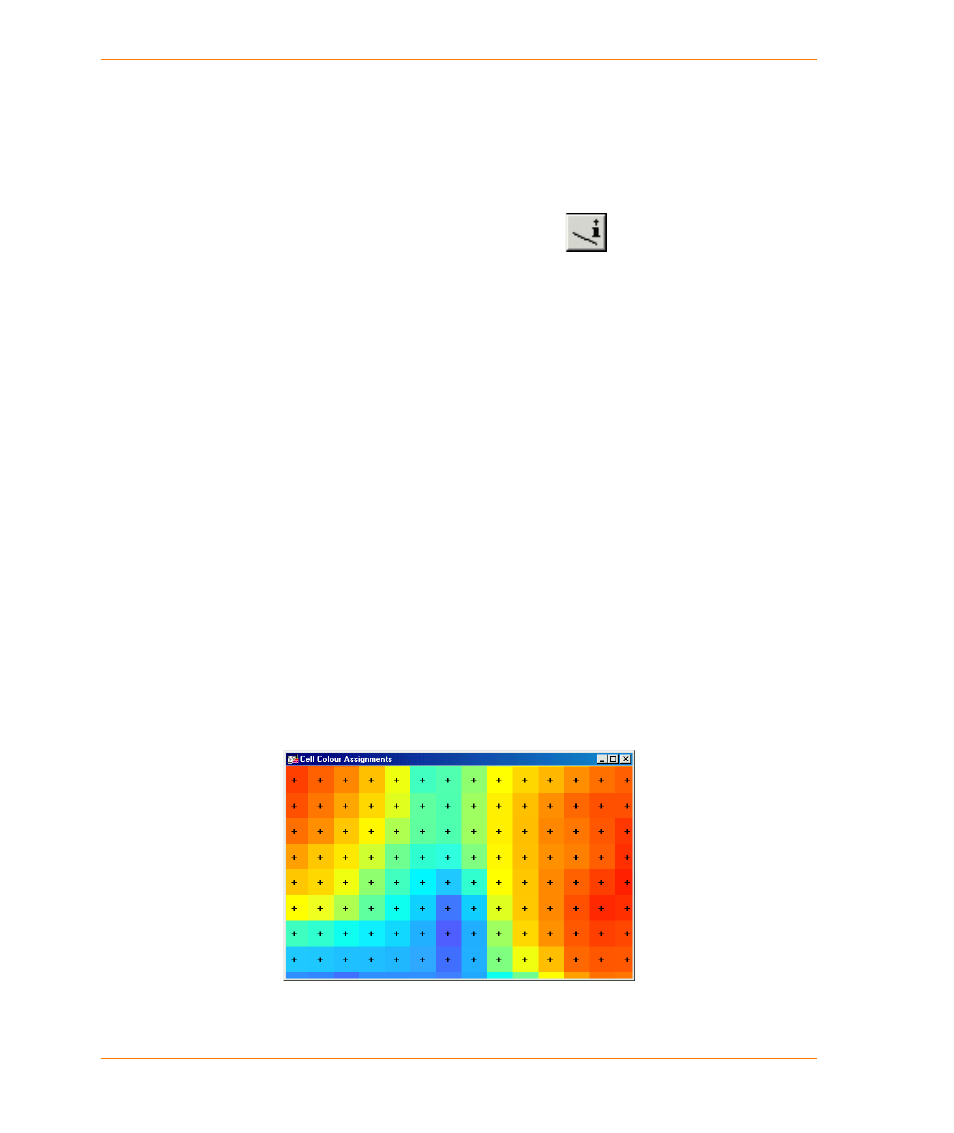
When a grid file is opened, the colour information in the header is read, and the colour profile is
assigned to the grid cells and displayed in the Map window. In this manner, the image displayed
on-screen is a true representation of the grid file, where each cell of the image represents a grid cell
centred on the grid node as illustrated in the next figure.
Each grid cell is assigned a colour value as defined in the header portion of the file.