Customizing a graph, Exploring the graph customization dialog box – Pitney Bowes MapInfo Vertical Mapper User Manual
Page 109
Chapter 6: Working with Grids
User Guide
107
Once all the settings have been made to the colour legend, a file name must be chosen before
selecting OK to continue. The on-screen grid file display is immediately updated. If a legend option
was chosen, this file must also be saved as a .TAB before being displayed in a different Map
Window.
Customizing a Graph
The graphing tool appears as part of four features, namely the grid histogram in the Grid Manager,
the Cross Section tool, the Point-to-Point Visibility tool, and the semivariogram in kriging
interpolations. Each of these features employ some, if not all, of the available graphing capabilities.
•
Position the cursor over a grid histogram, a cross-section graph, or a point-to-point solution
graph, right-click and choose the Customize Graph command.
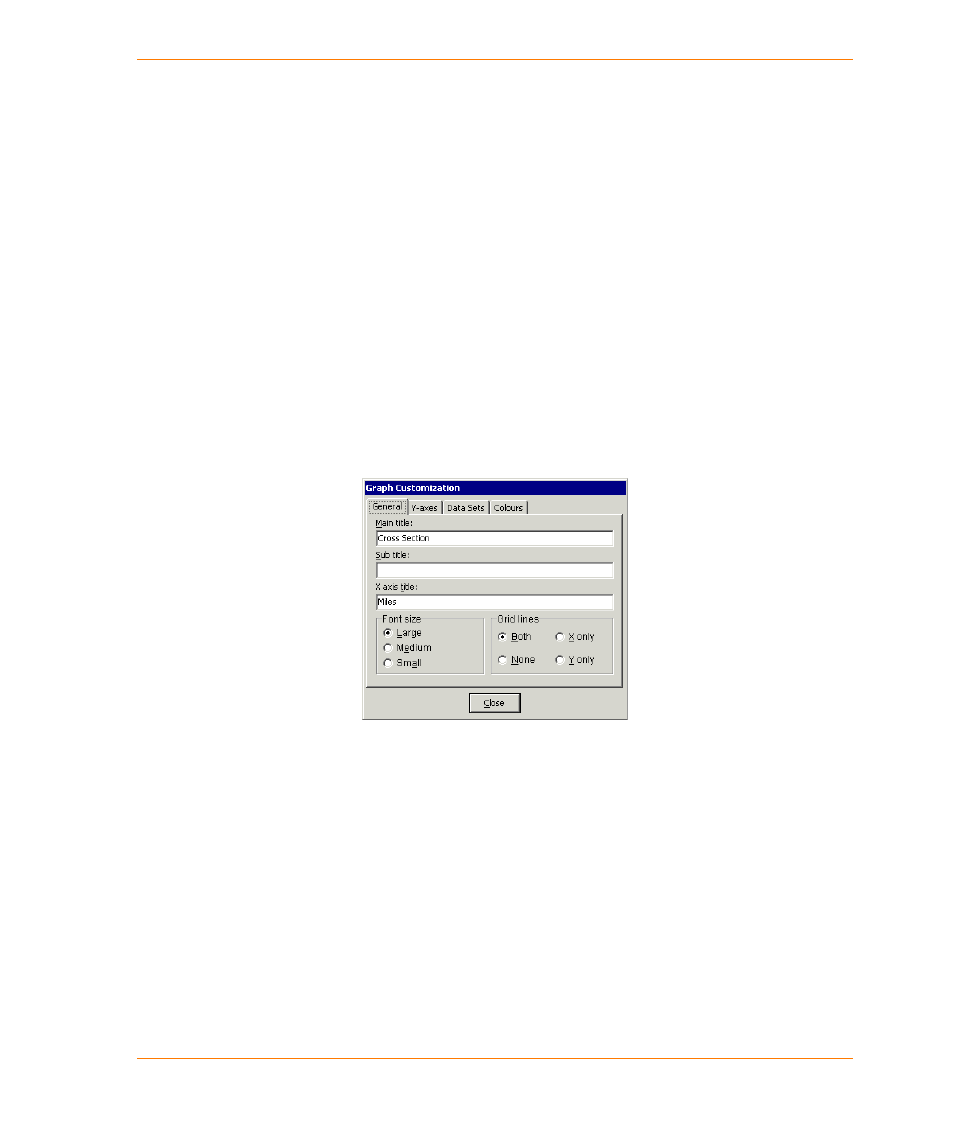
Exploring the Graph Customization Dialog Box
The Graph Customization dialog box contains four tabs that control settings for the graph layout and
plot style: the General tab, the Y-axes tab, the Data Sets tab, and the Colours tab.
The General tab contains settings that control the text displayed on the graph as well as the graph
lines.
•
The Main Title and Sub Title boxes enable you to enter appropriate titles for the graph
window.
•
The X Axis Title box enables you to assign a title to the x-axis.
•
The Font Size option buttons enable you to control the font size for all text entities in the
Graph window.
•
The Grid Lines option buttons enable you to choose the placement of the grid lines. You can
choose one of the following options: parallel to both the x- and y- axes, on the x-axis only, on
the y-axis only, or no grid lines.