Tuning the model – Pitney Bowes MapInfo Vertical Mapper User Manual
Page 161
Chapter 9: Data Analysis
User Guide
159
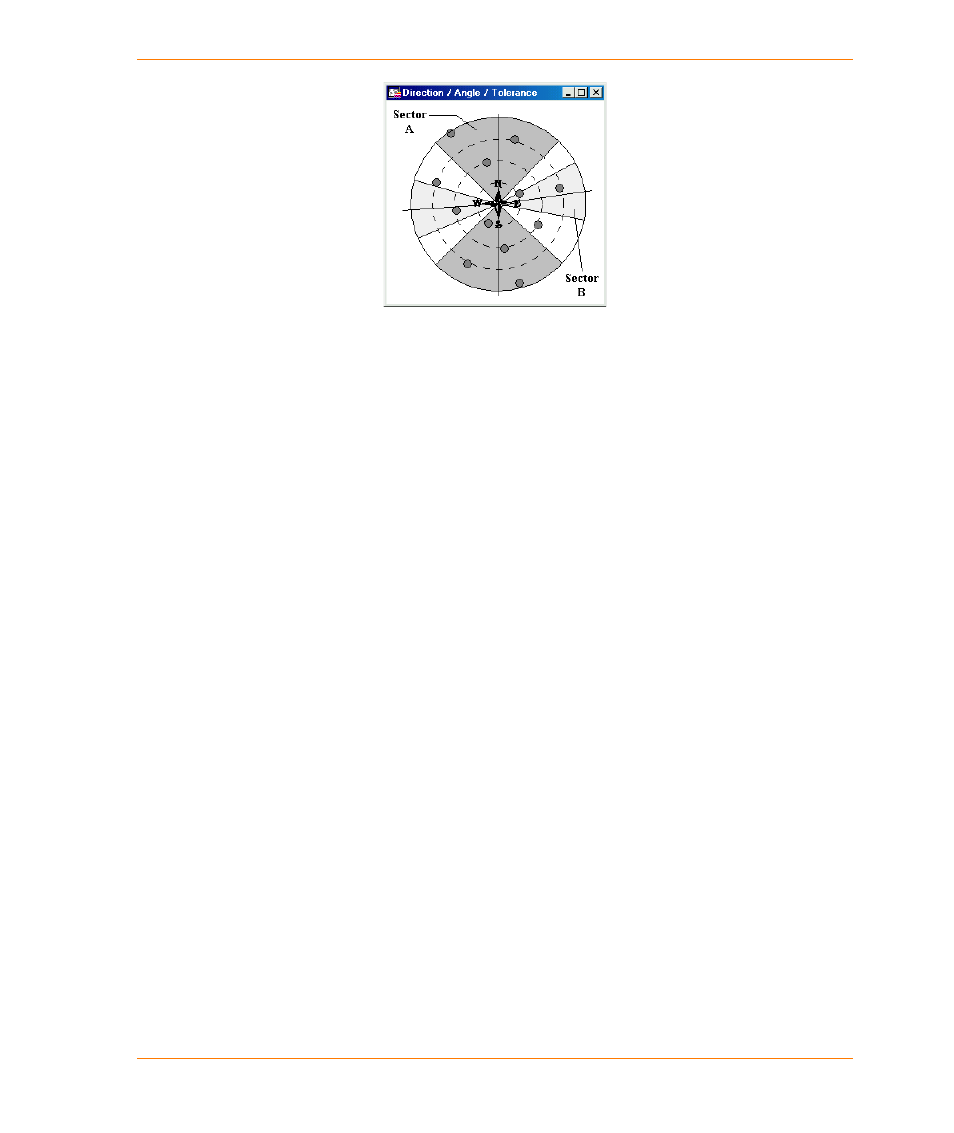
A two-directional semivariance search.
In the previous figure, two directions are analyzed, represented by the dark and light grey pie
shapes. It is important to note that although the diagram shows four pies, variance analysis is
always performed in opposing directions. When more than one direction is set, the angle to which
these sectors will be oriented must be specified. In the above diagram, the angles are zero degrees
(Sector A) and 80 degrees (Sector B). It is unlikely that data pairs will be found at exactly 0 degrees
or 80 degrees, thus you will need to define an interval around these exact values for which points will
be considered. This interval is known as the tolerance. In the above diagram, the zero degree
direction has a tolerance of 45 degrees and the 80 degree direction has a tolerance of 20 degrees.
Tuning the Model
After you have generated the experimental semivariogram, you can calculate a model curve that
closely fits the semivariogram.
The semivariogram models included with Vertical Mapper are Spherical, Exponential, Gaussian,
Power, Hole Effect, Quadratic, and RQuadratic (Rational Quadratic). When one or more of these
models is applied to the different directional semivariograms, the model curve can be adjusted to
better represent the variance in the data. After any of these models are applied, they can be further
modified by changing the sill and range values. The range is the greatest distance over which the
value at a point on the surface is related to the value at another point. Variance between points that
are farther apart than the range does not increase appreciably. Therefore, the semivariance curve
flattens out to a sill. Not all data sets exhibit this behaviour. In the next figure, the sill value is at
variance of 12 200, and the range value occurs at a distance of 12 000.