Exploring the principal components dialog box, Polygon overlay, 167 exploring the principal components dialog box – Pitney Bowes MapInfo Vertical Mapper User Manual
Page 169
Chapter 9: Data Analysis
User Guide
167
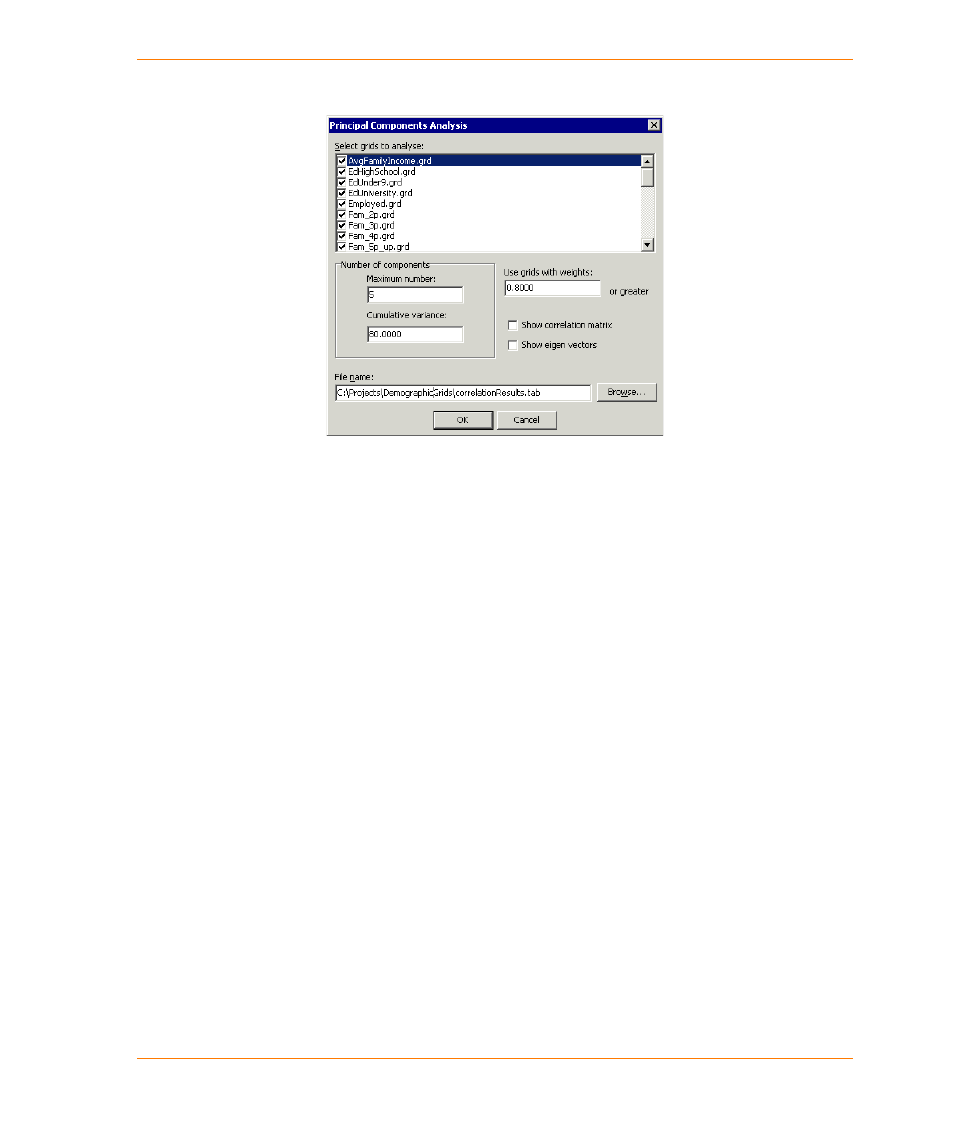
Exploring the Principal Components Dialog Box
The Select Grids to Analyze list displays all open grids. These are enabled by default. You can
clear any you do not want to include in the analysis.
The Maximum Number box enables you to specify the maximum number of principal components
you want to find.
The Cumulative Variance box enables you to specify the minimum cumulative variance you want
the analysis to achieve.
The Use Grids With Weights box enables you to specify the minimum weight factor grids must
have in order to be displayed in the output. Specifying any positive value will include grids with
negative correlation of at least that value.
The Show Correlation Matrix check box gives you the option of displaying a correlation matrix.
The Show Eigen Vectors check box gives you the option of generating a grid showing the Eigen
values for each of the components.
Polygon Overlay
The polygon overlay tool is a grid-based approach to performing a proportional sum analysis
between two region files. It is implemented to behave like the Update Column function in MapInfo
Professional. A proportional sum analysis is a way of transferring information from one region file
into another, taking into account any polygonal overlap between the two files. Generally, most
applications involve demographic information from census boundary files. For example, you might
update store trade areas with the total population or the average family income.
The process the polygon overlay tool follows can be conceptualized as a three step process. The
first step is the vector to raster conversion of the region file that contains the information to be
transferred. In most cases, this is demographic data contained in a census boundary file. This step is
similar to using the Region to Grid command.