Understanding natural neighbours – Pitney Bowes MapInfo Vertical Mapper User Manual
Page 188
186
Vertical Mapper 3.7
Understanding Natural Neighbours
While the strength of Vertical Mapper lies in the ability it gives you to create a continuous grid from
non-continuous data points, not all types of data are best represented as a continuously varying
surface. Some types of point data should be mapped as discrete regions within which the values
assigned to each point are constant. Point data such as this is referred to as having a natural
neighbour. Examples include store locations that have natural areas of influence and point
observations that record classified values (for example, land use).
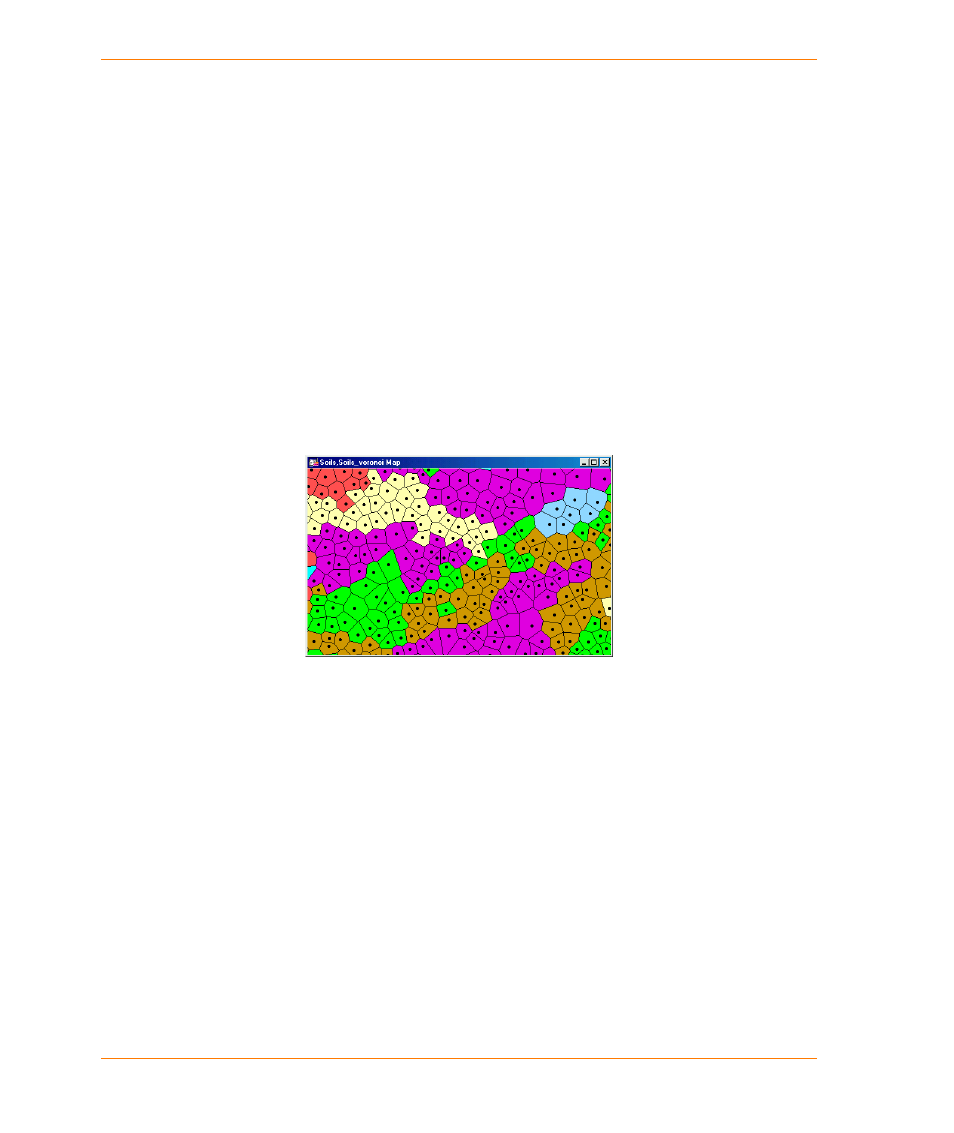
In Vertical Mapper, natural neighbours are built around data points using Delaunay triangulation. A
network of Thiessen polygons is generated from the point locations, creating what is called a
Voronoi diagram. As shown below, a Voronoi diagram is a network of MapInfo regions. Any location
within a region will always be closer to the enclosed point in that region than to the enclosed point of
any other region. Each site exerts a natural area of influence in relation to adjoining sites.
Assigning all the attribute fields from the original point data base to the new region file is a unique
feature of Vertical Mapper. Once the natural neighbours have been mapped, you can visually
analyze and compare any column of information attached to the region table using the MapInfo
Professional thematic mapping tools.
A Voronoi diagram showing the natural neighbours of a series of point observations.
One of the columns of data assigned to the region table has been thematically
mapped.
The same natural neighbour relationships that are used to examine the distribution and proximity of
point occurrences over space can also be applied to quantify point density. Of common concern
through a wide range of disciplines is the examination of the spatial occurrence of certain
phenomena. Examples that reflect the extensive range of studies covering such phenomena include
the location of towns in a state (geography) or seismic events over a continent (geology). Point
distribution over space can be observed qualitatively simply by plotting the data on a map. However,
producing a quantitative map of the distribution requires some analysis of the relative proximity of
the points in relation to one another.
Computing a natural neighbour (Voronoi) diagram for all points yields an excellent measurement of
point density. A representative density surface grid can be produced by calculating the area of the
natural neighbour region encompassing each point, attaching that area as an attribute to the point,
and generating a grid of the new point file through interpolation. This function has been automated in
Vertical Mapper and is a powerful tool in natural neighbour analysis.