Creating a trade area analysis model – Pitney Bowes MapInfo Vertical Mapper User Manual
Page 67
Chapter 4: Creating Grids Using Spatial Models
User Guide
65
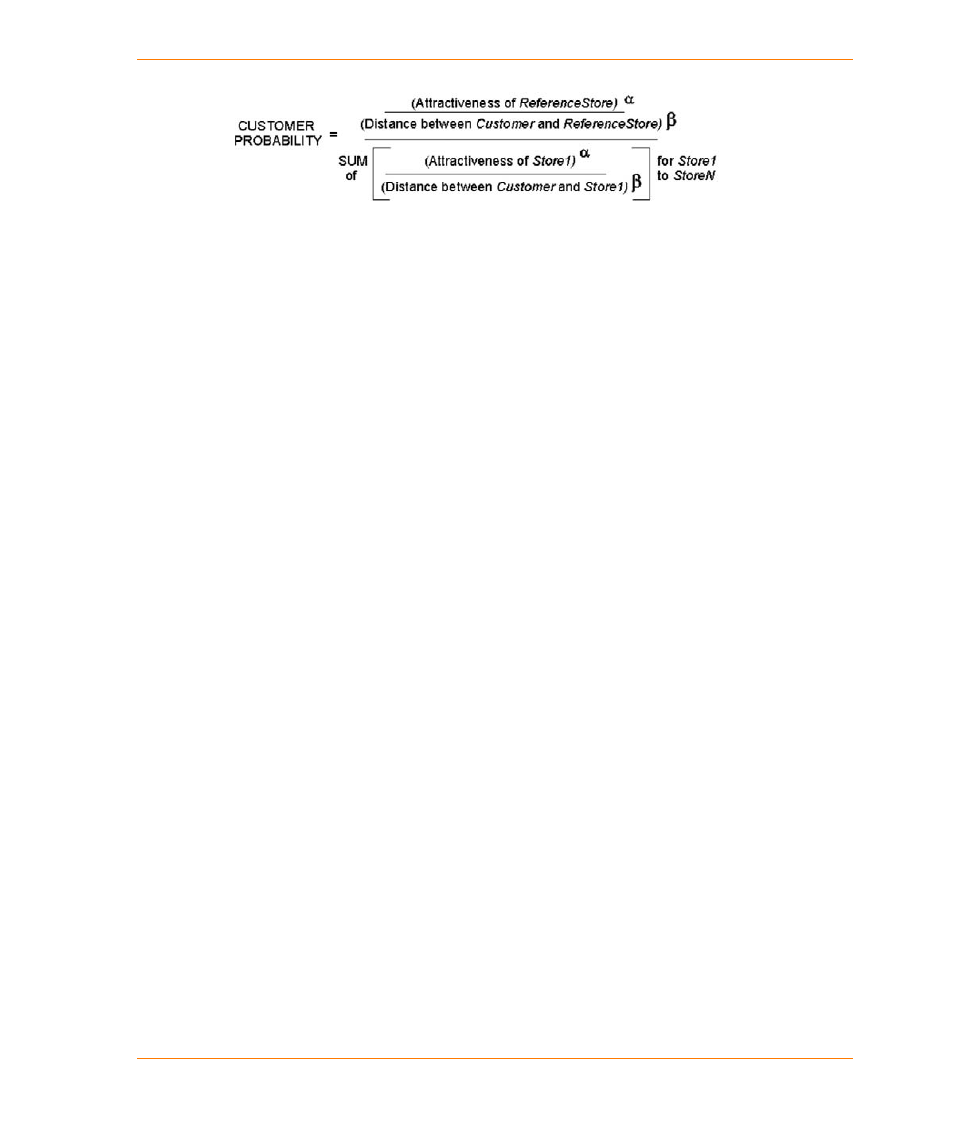
Where:
=
attractiveness coefficient estimated from empirical observations
=
distance decay coefficient estimated from empirical observations
This formula ensures that all the probabilities are between zero and one and sum to one when
considering all the shopping destinations. The and coefficients allow you to account for non-
linear behaviour when modeling the effects of store attractiveness or distance.
In terms of a supply and demand model, the resulting probability surface spatially represents the
supply side of the equation. It does not directly take into account any underlying demand data such
as consumer households or census tract information. To process the demand data so that revenue
calculations can be made, it is necessary to update the probability regions (produced by contouring
the probability grid) with any underlying income information you have.
Note Instead of updating the probability regions with overlying demographic (population/wealth)
point data, update the demographic data table with values from the probability grids. Open
the grid files and use the Point Inspection command from the Analysis menu in the Grid
Manager to add the grid values to the demographic data table.
Creating a Trade Area Analysis Model
1. From the Vertical Mapper menu, choose the Create Grid > Modeling command.
2. From the Select Modeling Method dialog box, under Trade Area Analysis, choose either the
Single Site or the Multiple Sites option.
3. Click the Next button.
4. In the Select Table and Column dialog box, click the Open Table button to add a table to the
Table to Grid list if the table of points you want to use is not listed.
5. From the Select Table to Grid list, choose the appropriate MapInfo table of points that contains
the geographic location of each store/site.
6. From the Attractiveness Column list, choose the column that contains the attractiveness value
for each site record. Store/site attractiveness is a relative number that can be defined by
parameters such as total floor space or shelf space, number of parking spaces, age of the store,
or any combination of elements which defines the appeal of an individual retail site.
7. For multiple sites, to use an unmapped MapInfo data file (an x, y, z file) that has not been
converted to a vector point table (using the Create Points command in MapInfo Professional), do
the following:
•
From the X Column list, choose the column containing the x-coordinates for each point.
•
From the Y Column list, choose the column containing the y-coordinates for each point.
•
Click the Projection button and choose the coordinate system of the location data.
α
β
α
β