Viewing information within graphs – Bio-Rad Bio-Plex Software® Upgrades and Conversions User Manual
Page 192
Bio-Plex Manager Software 6.1 User Guide | Analyzing the Results
180
To gain room for your graphs, you can click the Hide Legends checkbox from
the Graph Options menu.
To adjust y-axis values so that the data will be comparable throughout a series
of graphs, click the Adjust data to same y-axis scale checkbox.
To change the y-axis display from linear to logarithmic, click the Logarithmic
y-axis checkbox.
To adjust legends to accommodate the number of columns in your graph,
click the x-axis labels orientation drop-down menu from the Graphs Options
dialog. You can select vertical or horizontal legends, or legends angled at 30,
45, or 60 degrees.
Viewing Information within Graphs
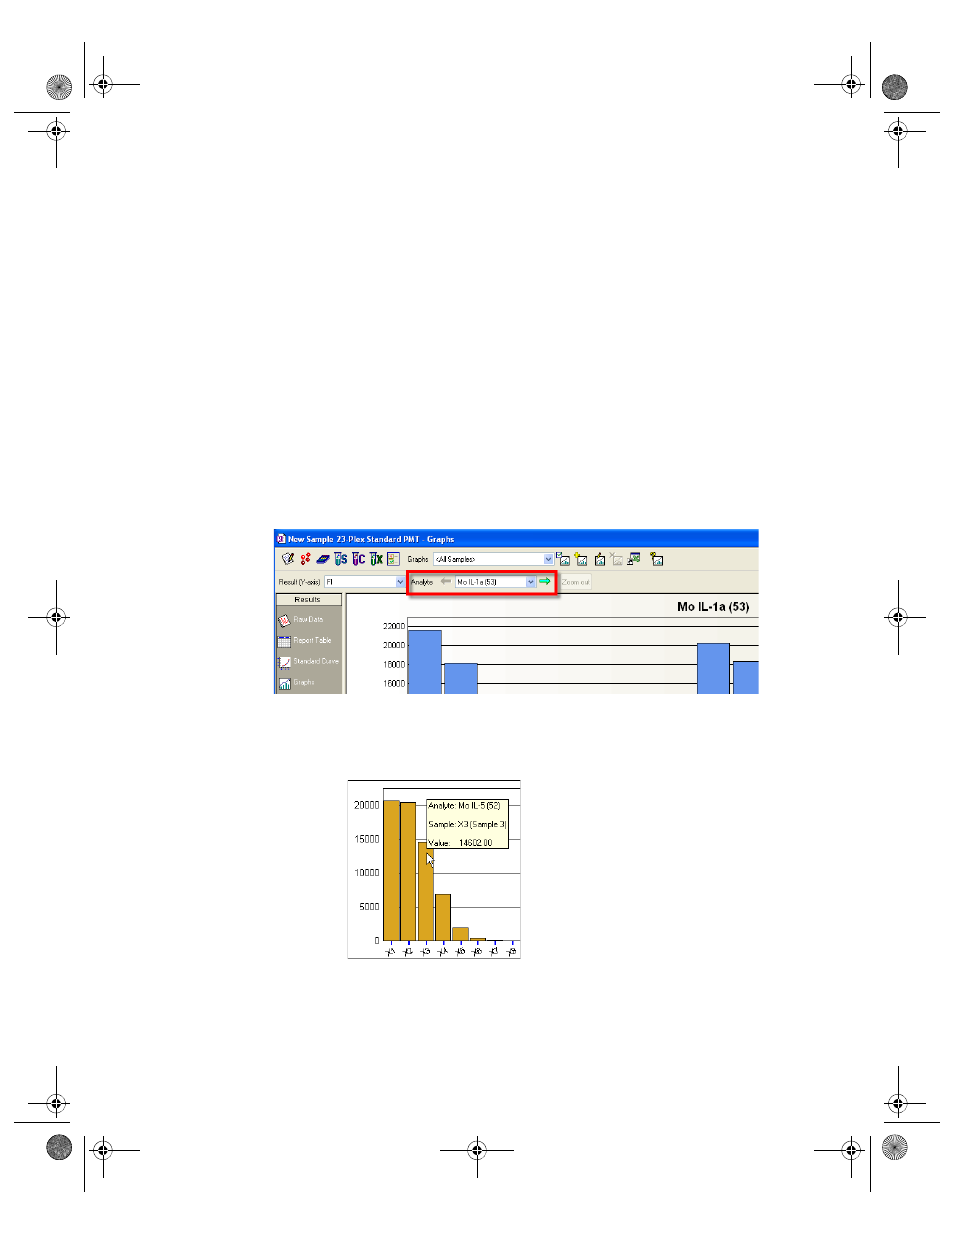
To browse through many analyte graphs, click the green arrows to the left and
right of the Analytes field in the toolbar. This displays a series of analyte
graphs without having to search and select from a long list.
Figure 166. Viewing a series of analyte graphs
Analyte names, sample names, user-defined descriptions, and values are
always available for view. Place your cursor over a specific column for a
moment and the data display.
Figure 167. Click to view data from graphs
BioPlex_6.book Page 180 Friday, September 23, 2011 11:55 AM