Bio-Rad Bio-Plex Software® Upgrades and Conversions User Manual
Page 188
Bio-Plex Manager Software 6.1 User Guide | Analyzing the Results
176
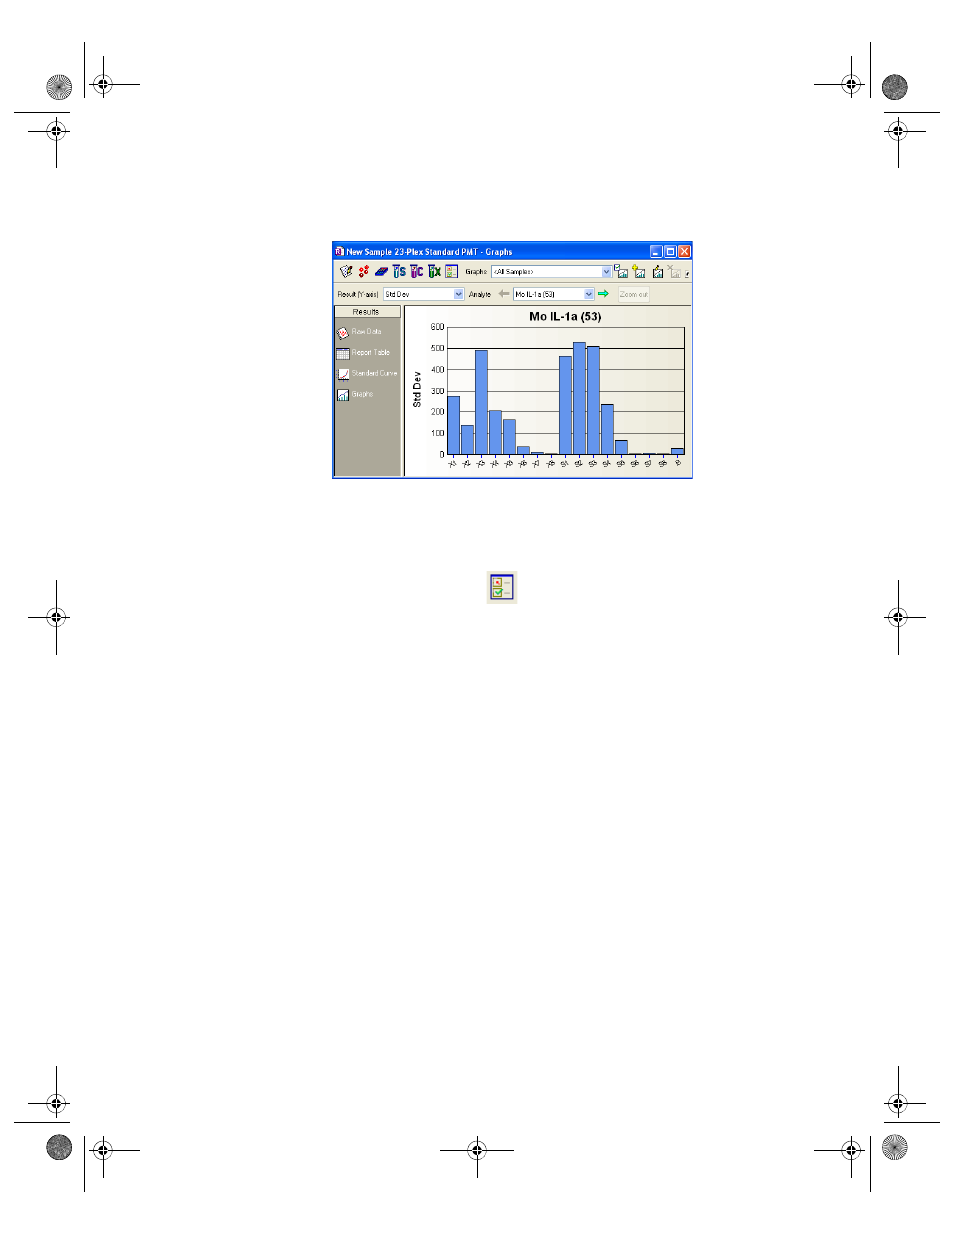
Figure 160. All Samples graph with Std Dev y-axis
Perform any data normalization functions before displaying your graphs.
If you want to see ratios among samples, or other normalization options, click
the Normalization Settings button
. See Data Normalization on page 207
for more information.
BioPlex_6.book Page 176 Friday, September 23, 2011 11:55 AM
This manual is related to the following products:
See also other documents in the category Bio-Rad Accessories for water:
- TransFectin™ Lipid Reagent (2 pages)
- Gene Pulser MXcell™ Electroporation System (19 pages)
- Gene Pulser MXcell™ Electroporation System (66 pages)
- Gene Pulser Xcell™ Electroporation Systems (83 pages)
- Gene Pulser® Electroporation Buffer (2 pages)
- MicroPulser™ Electroporator (31 pages)
- Helios® Gene Gun System (52 pages)
- PDS-1000 / He™ and Hepta™ Systems (51 pages)
- TGX™ FastCast™ Acrylamide Solutions (2 pages)
- Criterion™ TGX Stain-Free™ Precast Gels (16 pages)
- Criterion Stain Free™ Tris-HCl Gels (96 pages)
- Image Lab™ Software (212 pages)
- Gel Doc™ EZ System (22 pages)
- Mini-PROTEAN® TGX™ Precast Gels (52 pages)
- ChemiDoc™ MP System (8 pages)
- Image Lab™ Software (236 pages)
- ChemiDoc™ XRS+ System (42 pages)
- ChemiDoc™ XRS+ System (4 pages)
- ChemiDoc™ XRS+ System (50 pages)
- GS-800™ Calibrated Densitometer (444 pages)
- Criterion™ TGX™ Precast Gels (60 pages)
- Criterion™ Cell (13 pages)
- Image Lab™ Software (260 pages)
- Criterion™ XT Bis-Tris Precast Gels (26 pages)
- 2-D Electrophoresis Workflow (14 pages)
- EXQuest Spot Cutter (81 pages)
- Fluorescent Protein Stains (27 pages)
- 2-D Electrophoresis Workflow (22 pages)
- 2-D Electrophoresis Workflow (20 pages)
- PROTEAN® i12™ IEF System (4 pages)
- ReadyPrep™ 2-D Starter Kit (28 pages)
- Ready Gel® Zymogram Precast Gels (46 pages)
- Mini-PROTEAN 2-D Electrophoresis Cell (44 pages)
- Precision Plus Protein™ Prestained Standards (3 pages)
- Precision Plus Protein™ Unstained Standards (16 pages)
- Prestained SDS-PAGE Standards (3 pages)
- Unstained SDS-PAGE Standards (3 pages)
- Silver Stains (20 pages)
- Biotinylated Standards (3 pages)
- Biotinylated Standards (11 pages)
- IEF and 2-D Standards (3 pages)
- Mini-PROTEAN 2-D Electrophoresis Cell (20 pages)
- Mini-PROTEAN® Tetra Handcast Systems (10 pages)
- Mini-PROTEAN 3 Multi-Casting Chamber (10 pages)
- PROTEAN® Plus Hinged Spacer Plates and Combs (21 pages)