Histogram – Bio-Rad Bio-Plex Software® Upgrades and Conversions User Manual
Page 124
Bio-Plex Manager Software 6.1 User Guide | Running Protocols
112
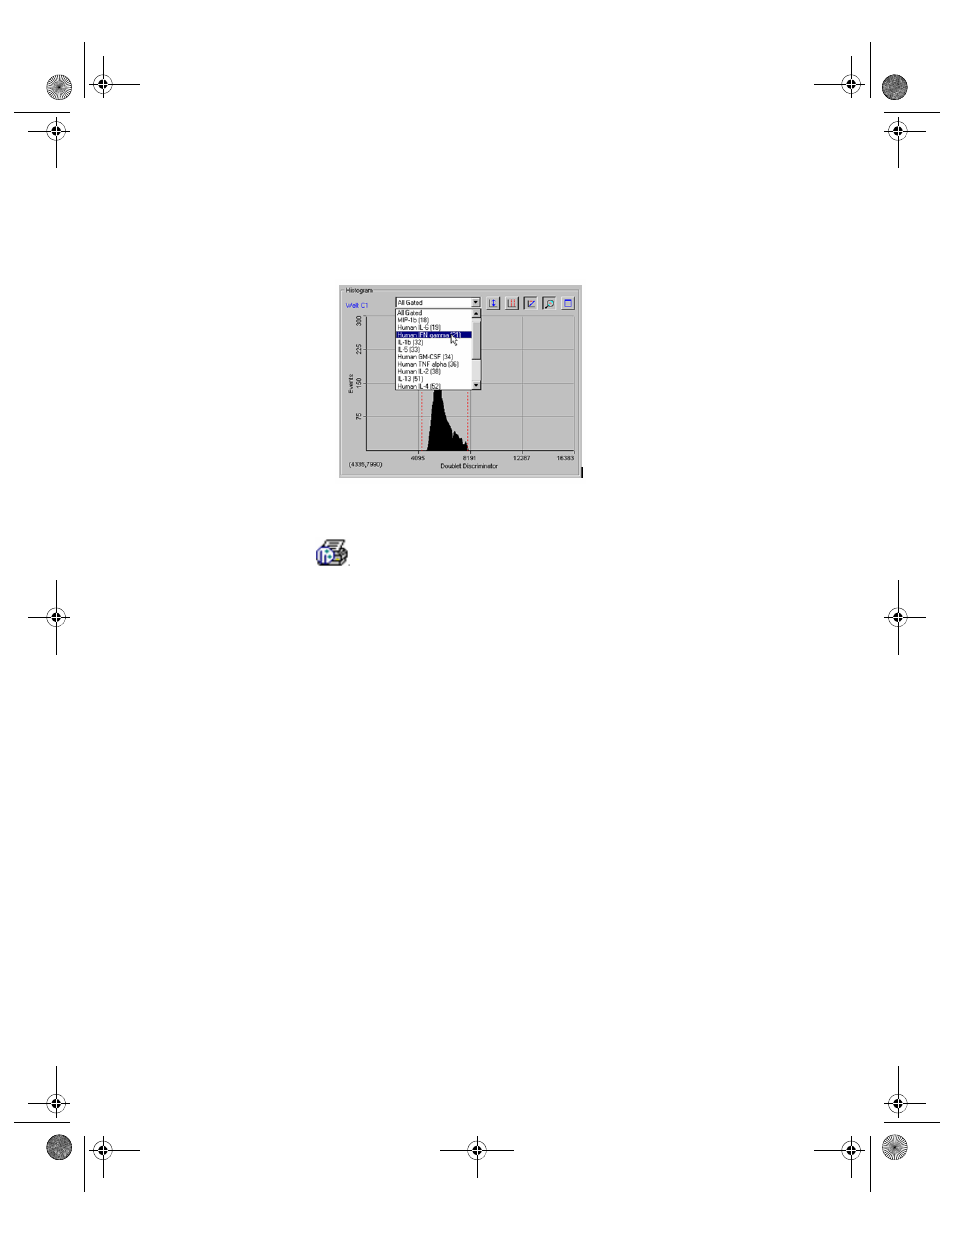
When viewing the histogram and bead map, you can choose to display all
analytes, each analyte separately, or all beads that pass through the discrimi-
nator gate. Make your selection from the pulldown menu above the histogram.
Figure 100. Selecting the analyte(s) to display
To print the histogram and/or bead map, click the Print Histogram/Bead Map
button
. This opens a small dialog in which you can select the
histogram, bead map, or both to print.
Histogram
The histogram plots the number of events per channel number for the
selected well, analyte(s), and channel type. An event is generated when
particles such as a bead or aggregated beads pass through the path of the
lasers. Each event generates signals in different channels:
•
The fluorochromes embedded in each bead generate signals in the
Classification 1 and Classification 2 channels
•
The fluorescent molecules bound to the analytes generate a signal
in the Reporter 1 channel
•
The light scatter of each bead generates a signal in the Doublet
Discriminator channel. The amount of light scatter is directly
proportional to bead size
The signals are reported as channel numbers. In the histogram, the y-axis
represents the events, and the x-axis represents the channel numbers from 1
to 32,766 for the selected channel type.
BioPlex_6.book Page 112 Friday, September 23, 2011 11:55 AM