Bio-Rad Bio-Plex Software® Upgrades and Conversions User Manual
Page 181
Standard Curve
169
Use the Error Bars pulldown list to select from several types of error bars
(such as 1-Std Dev, 2-Std Err) to plot for each point in the curve. If there is
only one replicate for a point, the bar will have a value of zero. If both external
and current standards are displayed in the graph, error bars will be displayed
for the external standards only.
Use the Regression Type pulldown list to choose from seven different
regression models to generate the standard curve (see next section).
NOTE: Changing the regression type will automatically recalculate all the data
in the Report Table. If you are unsure whether your data have been
recalculated, select Refresh Calculations from the View menu.
Use the Axis Transformation pulldown list to select the standard curve axis
scale. Four combinations of linear and logarithmic axis scales are available.
NOTE: Changing the axis transformation will only change the display of the
curve—not the calculated data.
You can use a different regression model for each analyte. Deselect the Same
Regression Type for All Analytes checkbox, select a different analyte from the
pulldown list, and select the regression type to use for that analyte.
From the Curve Options menu, select the Swap XY Axes to change the x and
y axes of the curve.
From the Curve Options menu, select the Show Conc Range Lines to display
this range as dotted lines on your graph.
Select the Show Unknown Samples checkbox to display your Unknown
samples as green triangles in your graph.
Select the Show Control Samples checkbox to display your Control Samples
as yellow triangles in your graph.
The Curve Fit area contains automated optimization controls discussed in
greater detail in Standard Curve Optimizer on page 199. You can optimize
individual or all analytes, undo the optimization, and clear outliers from your
display.
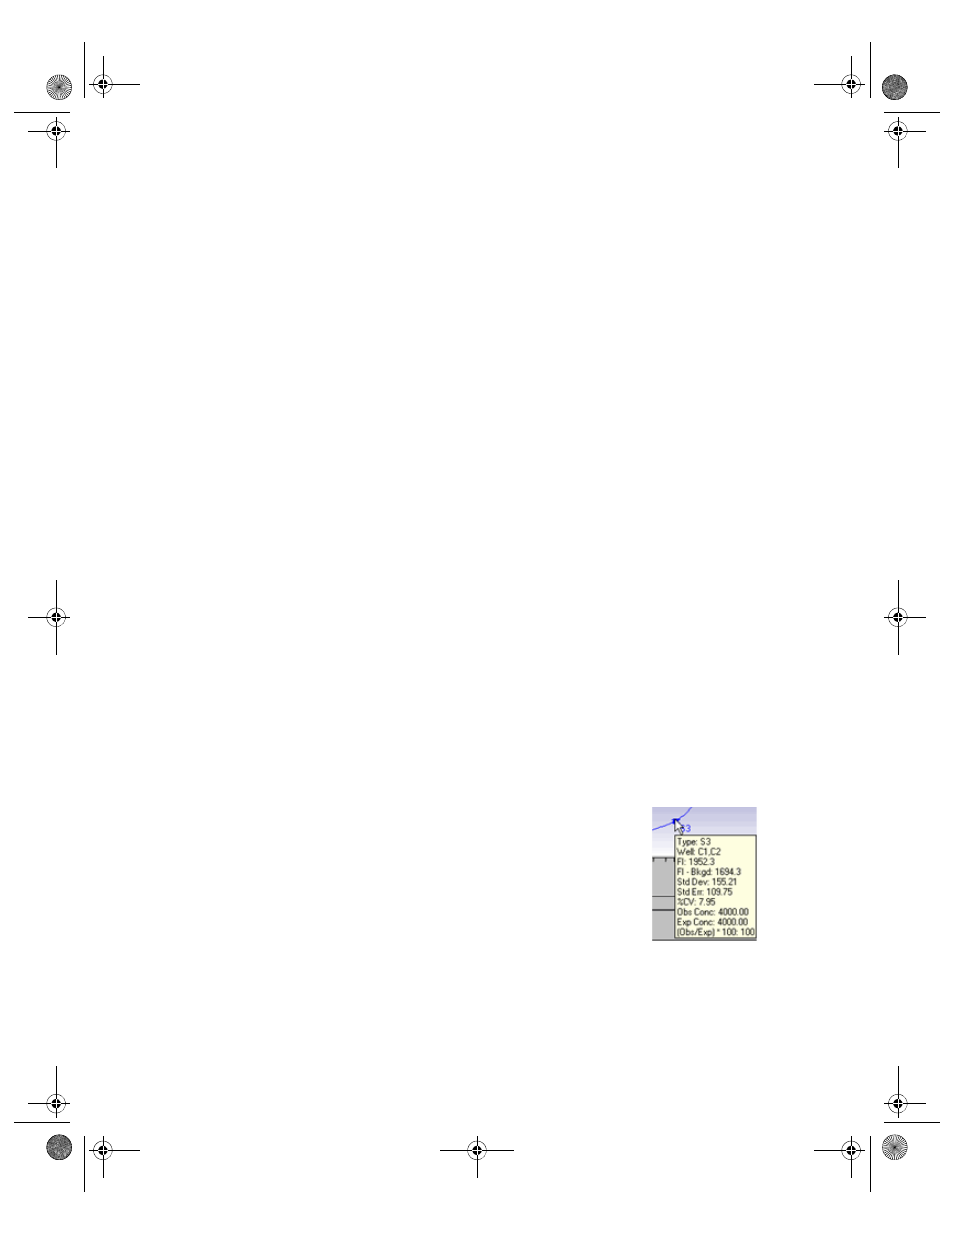
To display all the data for each standard sample point in
the curve, position your cursor over the point. A pop-up
box will list the data.
Figure 154. Pop-up data for a standard sample point in
the curve
BioPlex_6.book Page 169 Friday, September 23, 2011 11:55 AM