Bowers Group Sylvac D100S Readouts User Manual
Page 25
24
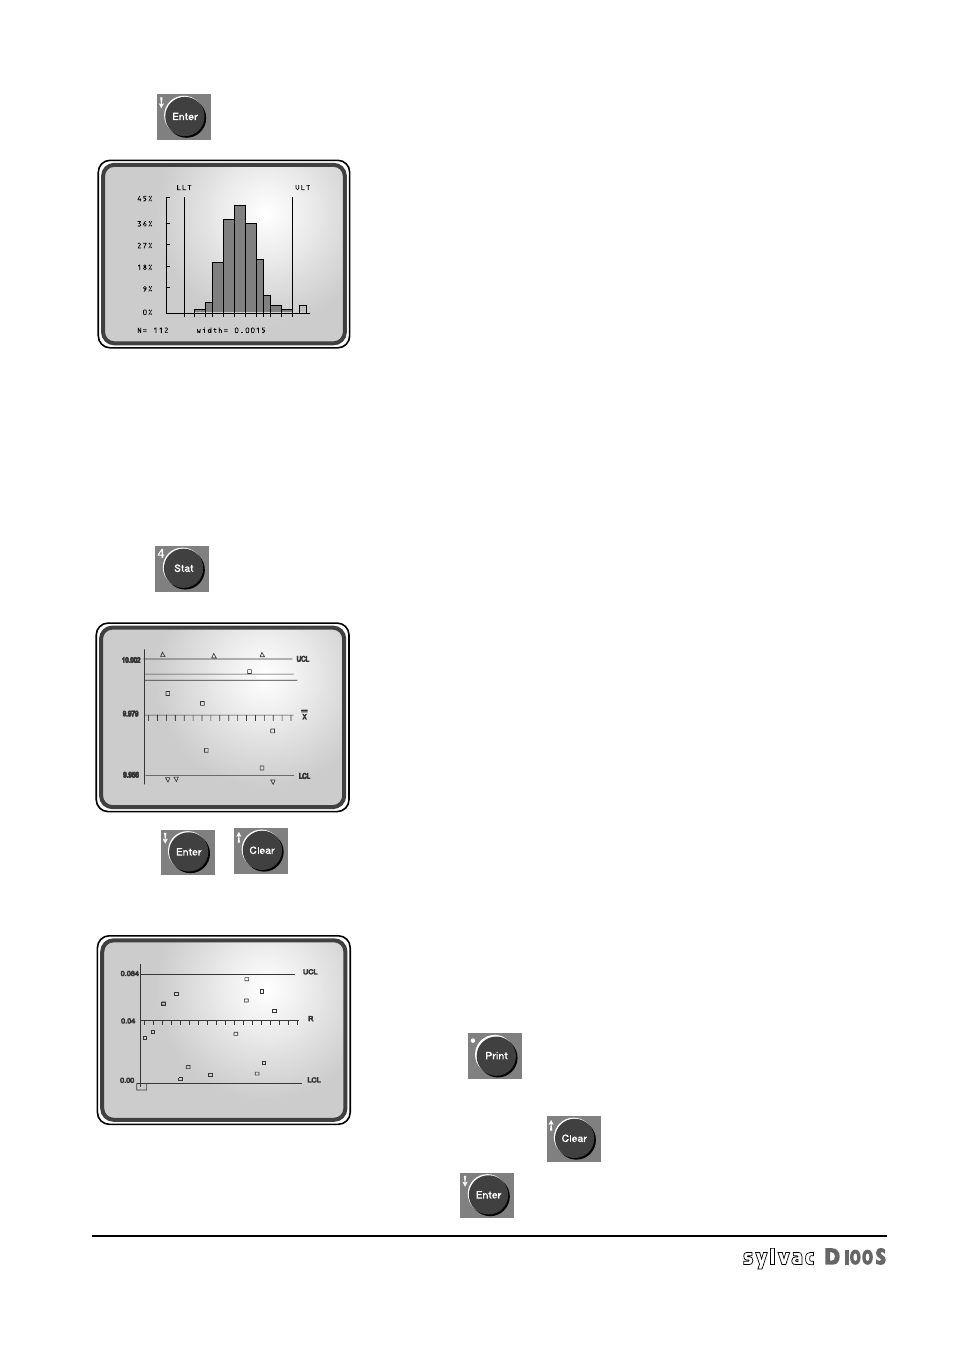
3) Press
, the histogram of stored values will be displayed:
The number of cells is determined with the formula: n =
√N
but at least 5 cells and maximum 11 cells, n being always odd. The Y axis
represents % number of stored values for each cell.
The lower tolerance limit is indicated by LLT (lower tolerance limit) and the
upper limit by ULT (upper tolerance limit).
Values outside tolerances limits are displayed with a grey cell beside each tole-
rance.
N = total number of stored values.
width = cell width of histogram.
Histogram printing is available in 40 or 80 column output formats.
2nd choice:
_
X/R control charts
The value stored in memory are divided into sub-groups of five measures. M represents the number of sub-groups and
n the number of measures memorized in the last sub-.group. The date and time are stored with the sub-group.
1/ Press
The
_
X chart appears:
▲ Value greater than upper control limit.
▼ Value less than lower control limit
UCL: Upper control limit =
_
_
X + A2
_
R, with A2 = 0.577 for n = 5
LCL: Lower control limit =
_
_
X - A2
_
R, with A2 = 0.577 for n = 5
= = = : Target value
2/ Press
(
exit from charts display)
The R chart reappears
UCL: Upper limit = D4
_
R, with D4 = 2.114 for n = 5
LCL: Lower limit = D3
_
R, with D3 = 0 for n = 5
To print, press
(only in 80 column format)
To return to
_
X card, press
To exit, press