Adc & dac digital filters, Figure 41. adc frequency response, Figure 42. adc stopband rejection – Cirrus Logic CS42L56 User Manual
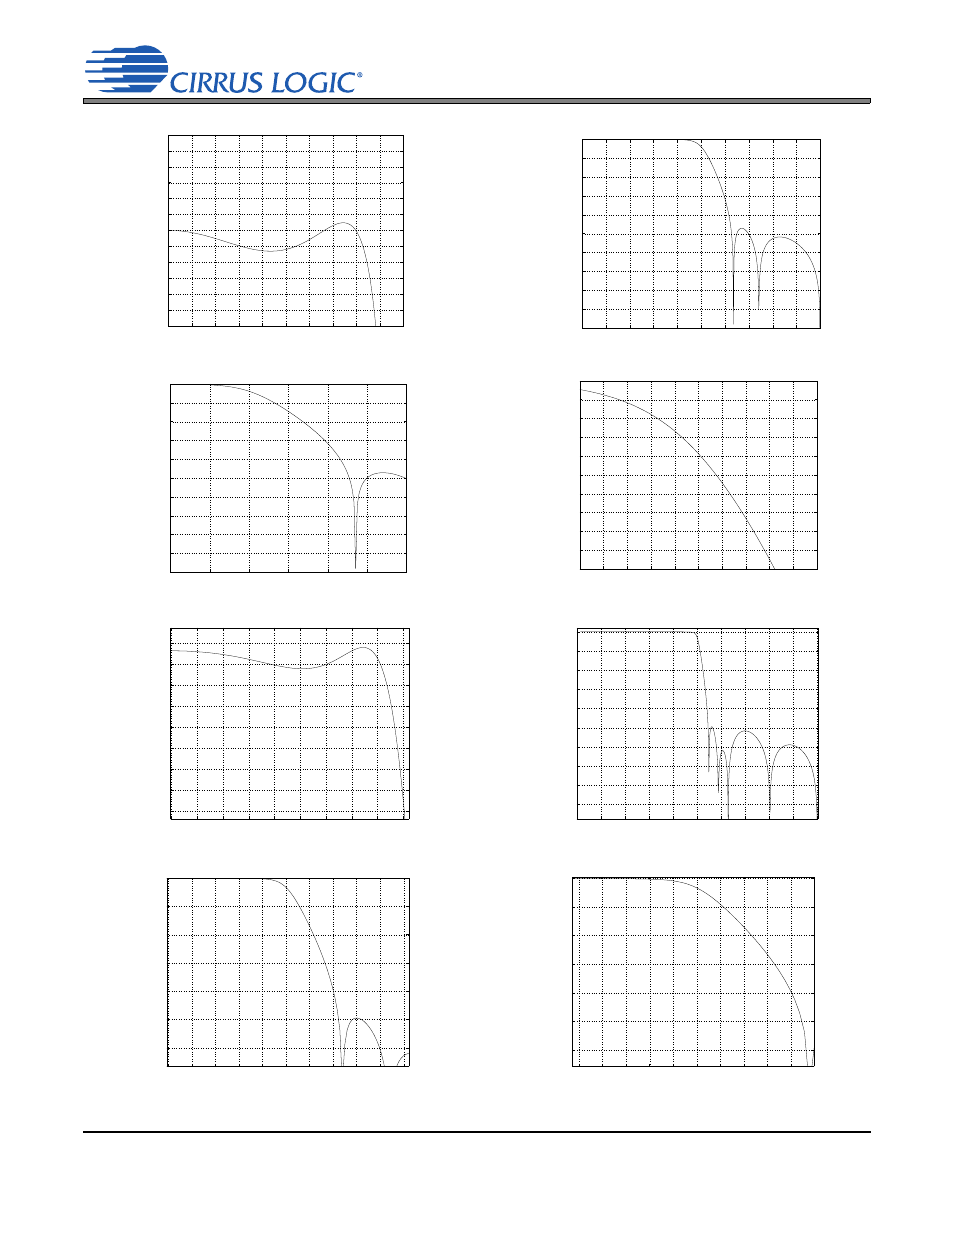
Page 89: Figure 43. adc transition band, Figure 44. adc transition band detail, Figure 45. dac frequency response, Figure 46. dac stopband, Figure 47. dac transition band, Figure 48. dac transition band (detail), Response plots
DS851F2
89
CS42L56
9. ADC & DAC DIGITAL FILTERS
0
0.1
0.2
0.3
0.4
0.5
0.6
0.7
0.8
0.9
1
−100
−90
−80
−70
−60
−50
−40
−30
−20
−10
0
Frequency (normalized to Fs)
Magnitude (dB)
0
0.05
0.1
0.15
0.2
0.25
0.3
0.35
0.4
0.45
0.5
−0.25
−0.2
−0.15
−0.1
−0.05
0
0.05
0.1
0.15
0.2
0.25
Frequency (normalized to Fs)
Magnitude (dB)
Figure 41. ADC Frequency Response
Figure 42. ADC Stopband Rejection
0.4
0.45
0.5
0.55
0.6
0.65
−100
−90
−80
−70
−60
−50
−40
−30
−20
−10
0
Frequency (normalized to Fs)
Magnitude (dB)
0.45
0.46
0.47
0.48
0.49
0.5
0.51
0.52
0.53
0.54
0.55
−10
−9
−8
−7
−6
−5
−4
−3
−2
−1
0
Frequency (normalized to Fs)
Magnitude (dB)
Figure 43. ADC Transition Band
Figure 44. ADC Transition Band Detail
0
0.1
0.2
0.3
0.4
0.5
0.6
0.7
0.8
0.9
1
−90
−80
−70
−60
−50
−40
−30
−20
−10
0
frequency (Normalized to Fs)
Magnitude (dB)
Figure 45. DAC Frequency Response
Figure 46. DAC Stopband
0
0.05
0.1
0.15
0.2
0.25
0.3
0.35
0.4
0.45
−0.05
−0.04
−0.03
−0.02
−0.01
0
0.01
0.02
0.03
frequency (Normalized to Fs)
Magnitude (dB)
Figure 47. DAC Transition Band
Figure 48. DAC Transition Band (Detail)
0.4
0.42
0.44
0.46
0.48
0.5
0.52
0.54
0.56
0.58
0.6
−60
−50
−40
−30
−20
−10
0
frequency (Normalized to Fs)
Magnitude (dB)
0.45
0.46
0.47
0.48
0.49
0.5
0.51
0.52
0.53
0.54
−60
−50
−40
−30
−20
−10
0
frequency (Normalized to Fs)
Magnitude (dB)