Performance graphs menu, Basic monitoring – HP Surestore 6164 Switch User Manual
Page 99
Web Tools User’s Guide
4-27
Switch View
4
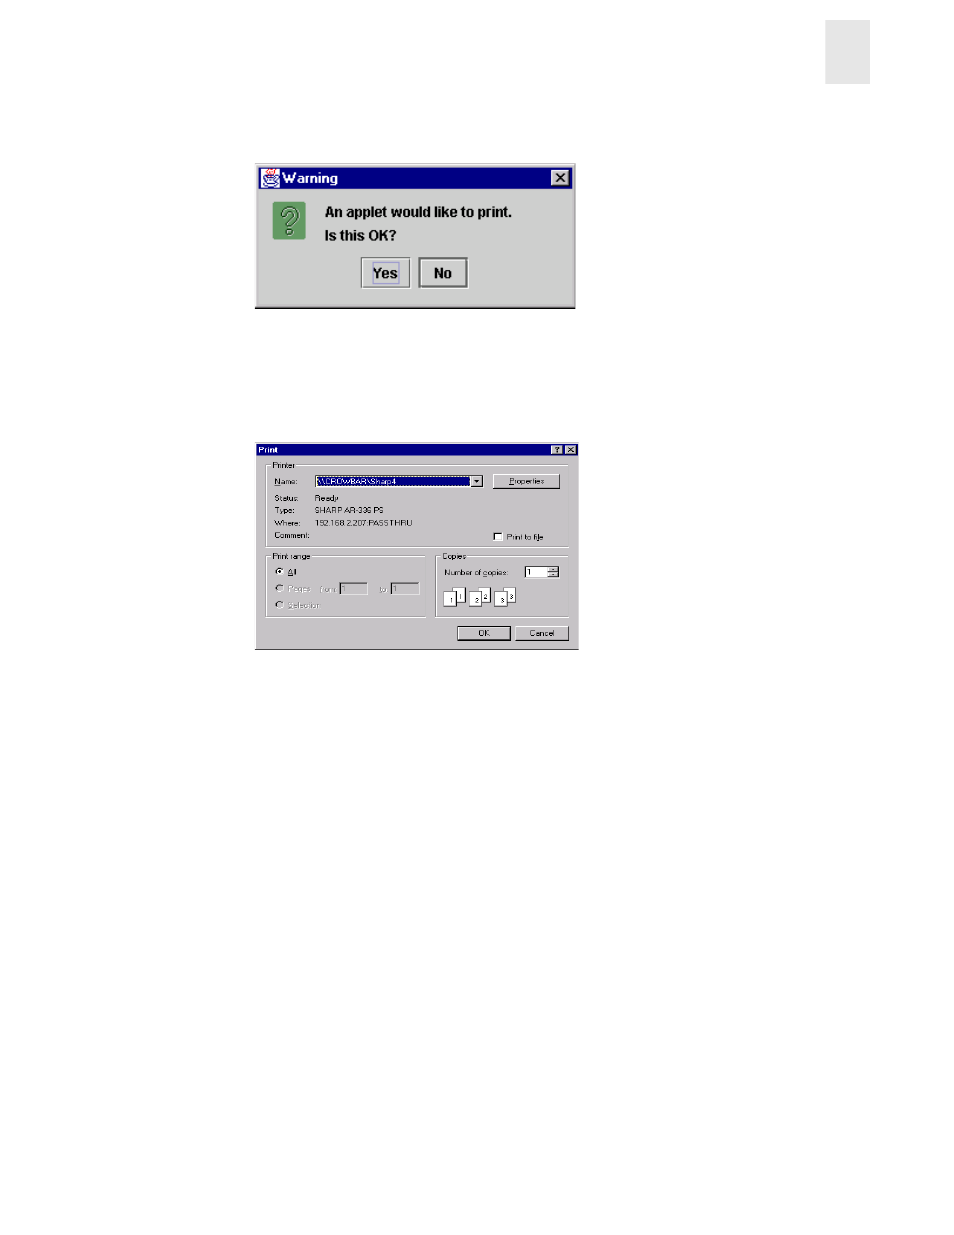
A dialog box appears, as shown in Figure 4-27.
Figure 4-27 Applet Dialog Box
4.
Click Yes to accept.
The Print Dialog Box appears, as shown in Figure 4-28. Select print options such as
printer choice, printing to a file, print properties, and the number of pages to print.
Figure 4-28 Print Dialog Box
5.
Select OK.
Each report prints two pages. The first is the banner page with the name of the graph, and
the second is the actual graph.
Performance Graphs Menu
The Performance Graphs menu of the Performance Monitor feature is made up of the following
sub-menus:
•
Basic Monitoring
•
Advanced Monitoring (Optional Software)
Basic Monitoring
The Basic Monitoring sub-menu allows you to create graphs that monitor the functionality of
switches and ports, such as performance and traffic. Unlike the Advanced graphs, Basic graphs do
not display device-specific information.
To access the Basic Monitoring pull-down menu: