N. table 4-2 and – HP Surestore 6164 Switch User Manual
Page 100
4-28
Web Tools User’s Guide
Switch View
4
1.
Select the Performance icon (from the Switch View).
2.
Select the Performance Graphs pull-down menu.
3.
Select the Basic Monitoring option.
The following section describes the types of graphs that are available through the Basic Monitoring
menu.
Port Throughput Graph
An example of a Port Throughput Graph, monitoring bytes transmitted and received, is shown in
Figure 4-29
Figure 4-29 Port Throughput Graph Example
Table 4-2
Graphs Displayed on a Basic Canvas
Scope
Graph Name
Type
Description
Port
Port Throughput Graph
Line
Displays the performance of a port
based on four-byte frames received
and transmitted. See Figure 4-29
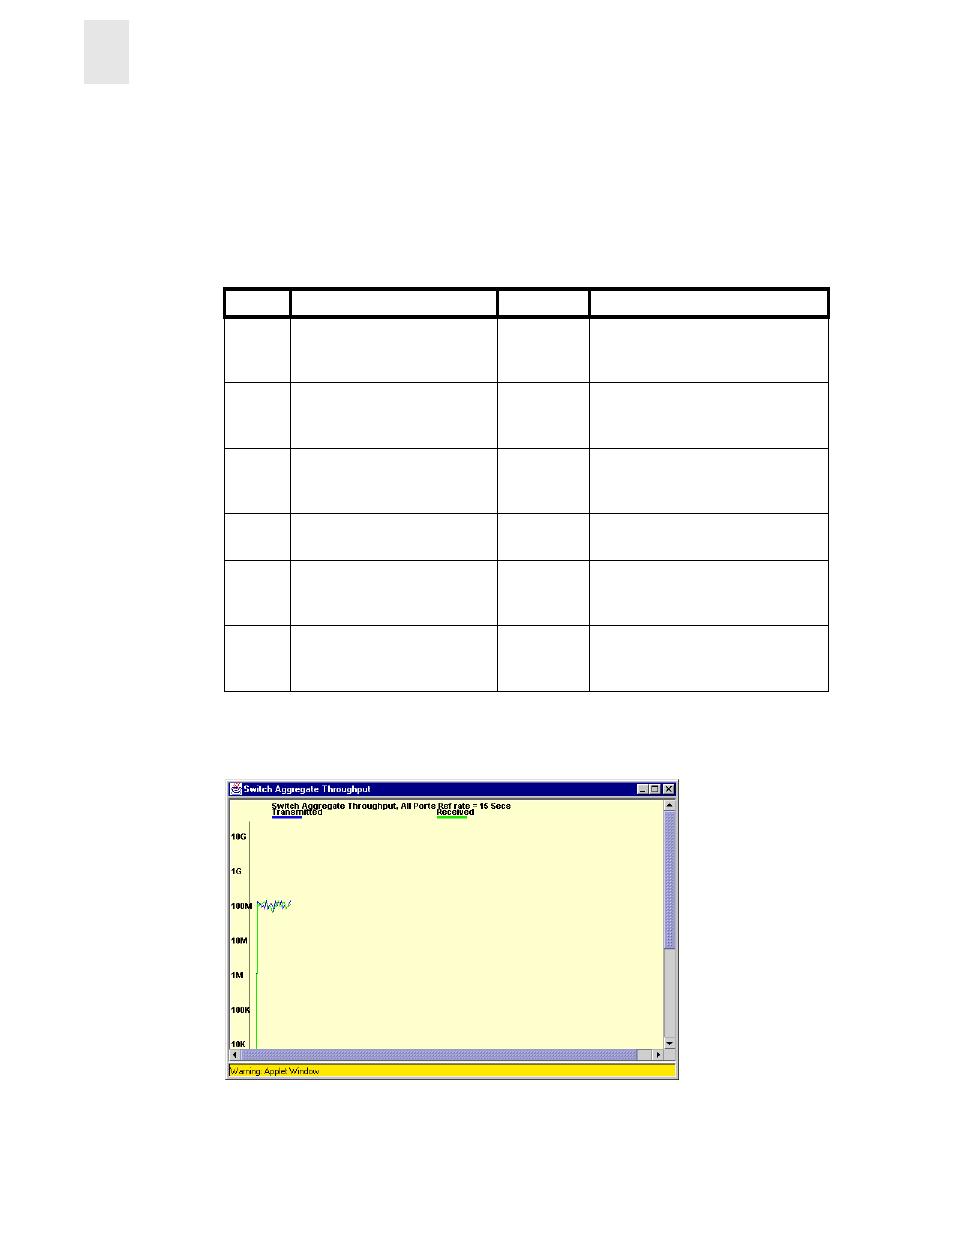
Switch
Switch Aggregate Throughput
Graph
Line
Displays the aggregate performance
of all ports of a switch. See
Figure 4-30.
Switch
Switch Throughput Utilization
Graph
Horizontal
Bar
Displays the port throughput at the
time the sample is taken. See
Figure 4-31.
Switch
Port Error Graph
Line
Displays a line of CRC errors for a
given port. See Figure 4-33.
Switch
Switch Percent Utilization
Graph
Horizontal
Bar
Displays the percentage of usage of
a chosen switch at the time the
sample is taken. See Figure 4-34.
Switch
Port SnapShot Error Graph
Vertical Bar
Displays the CRC error count
between sampling periods for all the
ports on a switch. See Figure 4-35.