Graph types – HP Surestore 6164 Switch User Manual
Page 91
Web Tools User’s Guide
4-19
Switch View
4
•
Any graph can “Zoom In”, or be magnified and detached from the main canvas or “Removed”
from the main canvas using a pop-up menu. The pop-up menu is displayed by pointing the
mouse at a any graph on the main canvas and clicking the right mouse button. To re-attach the
(Zoomed Out) detached graph back to the main canvas, you can point the mouse to the
detached graph, click the right button and select “Zoom In.”
•
Each graph can be printed to a printer of choice.
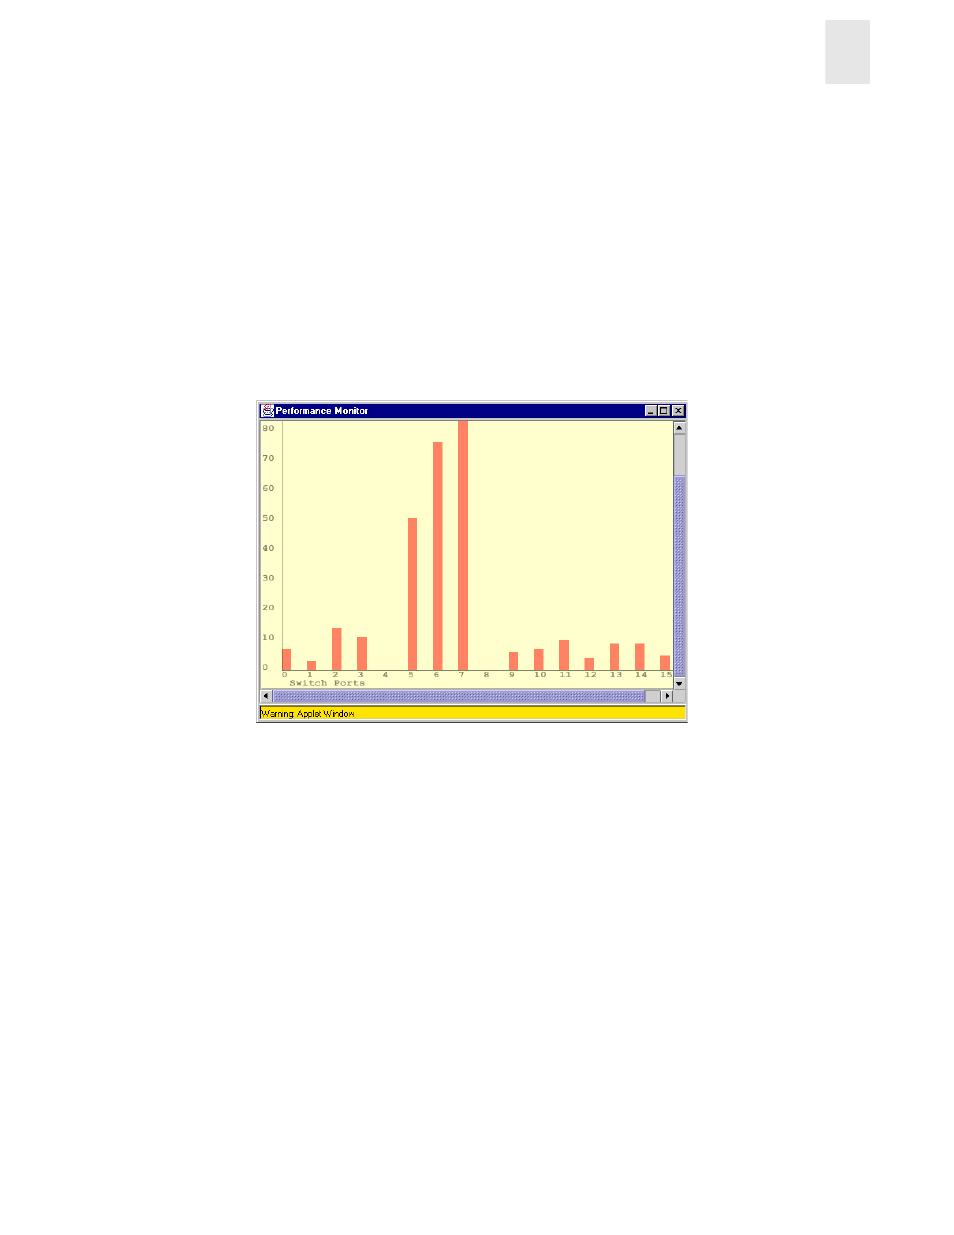
Graph Types
Figure 4-16 through Figure 4-18 shows four types of graphs used to display port and switch
information. Table 4-2 and Table 4-3 describe the graphs that can be displayed on a canvas. All
graphs are real-time. Each graph is updated either every 5 seconds or every 15 seconds.
Figure 4-16 Vertical Bar Chart Example