Performance monitor, Current settings tab, 4current settings tab – HP Surestore 6164 Switch User Manual
Page 89
Web Tools User’s Guide
4-17
Switch View
4
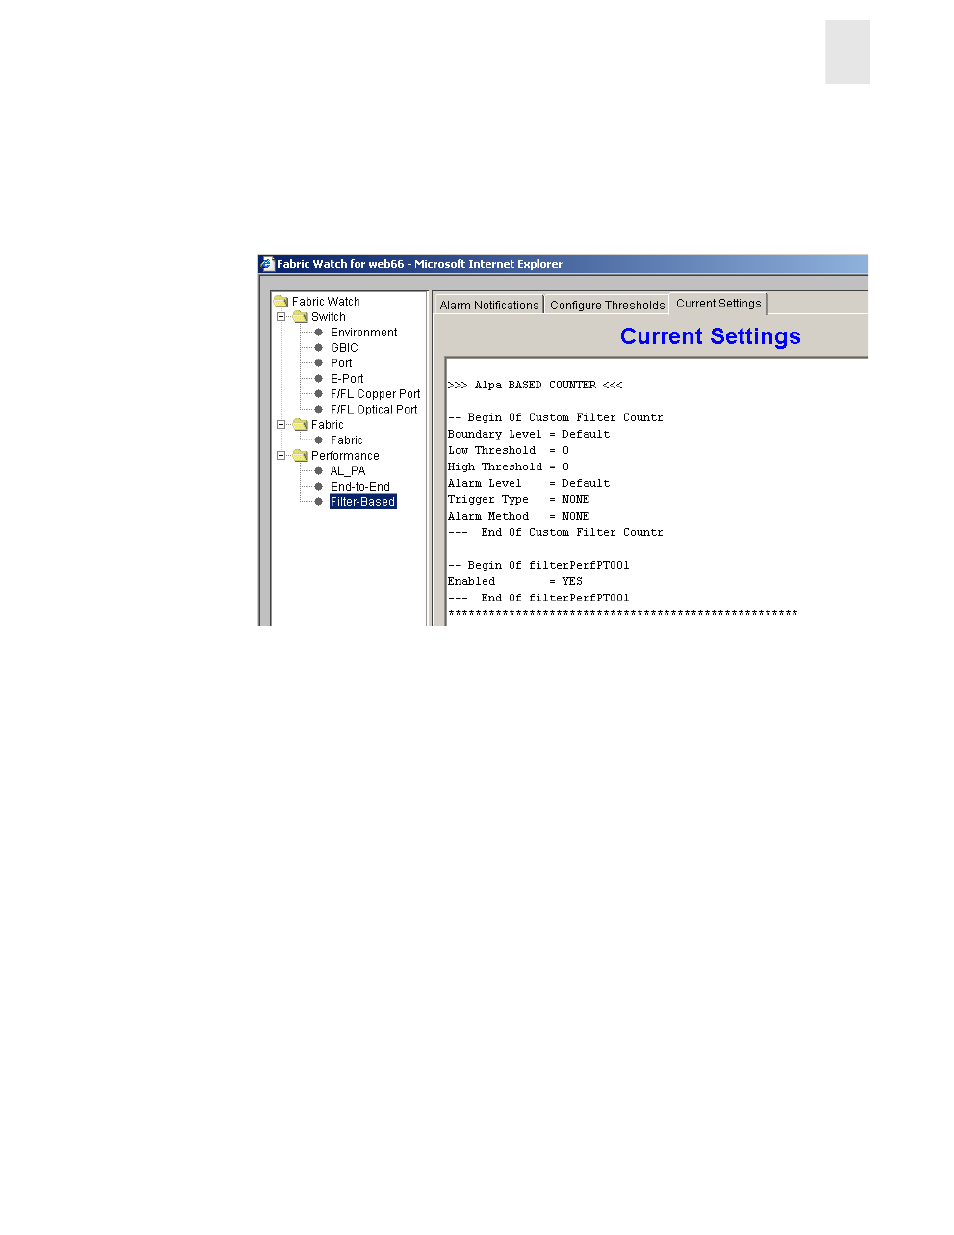
Current Settings Tab
Use the Current Settings tab to view the current Fabric Watch threshold parameters for the area
selected in the Fabric Watch tree.
The Current Settings tab is shown in Figure 4-14.
Figure 4-14 Current Settings tab in the Fabric Watch View
Performance Monitor
The Performance Monitor performs the following functions:
•
Graphically displays throughput (megabytes per second) for each port and for the entire
switch. “Port throughput” is the number of bytes received at a port plus the number of bytes
transmitted. “Switch throughput” is the sum of the throughput for all the ports. The
Performance Monitor also allows the graphing of traffic based on the Source ID and the
Destination ID hardware filtering mechanism.
•
Provides the ability to change the configuration of a switch or port visually by using the
graphics.
Note:
For more information about the Performance Monitor, see the Performance Monitor User’s
Guide.
To access the Performance Monitor:
1.
Launch the Web browser and enter the switch name or IP address in the Location/Address
field.
(Example:
2.
Press Enter.
Web Tools launches, displaying the Fabric View.