HP Surestore 6164 Switch User Manual
Page 105
Web Tools User’s Guide
4-33
Switch View
4
SID/DID Performance Graph
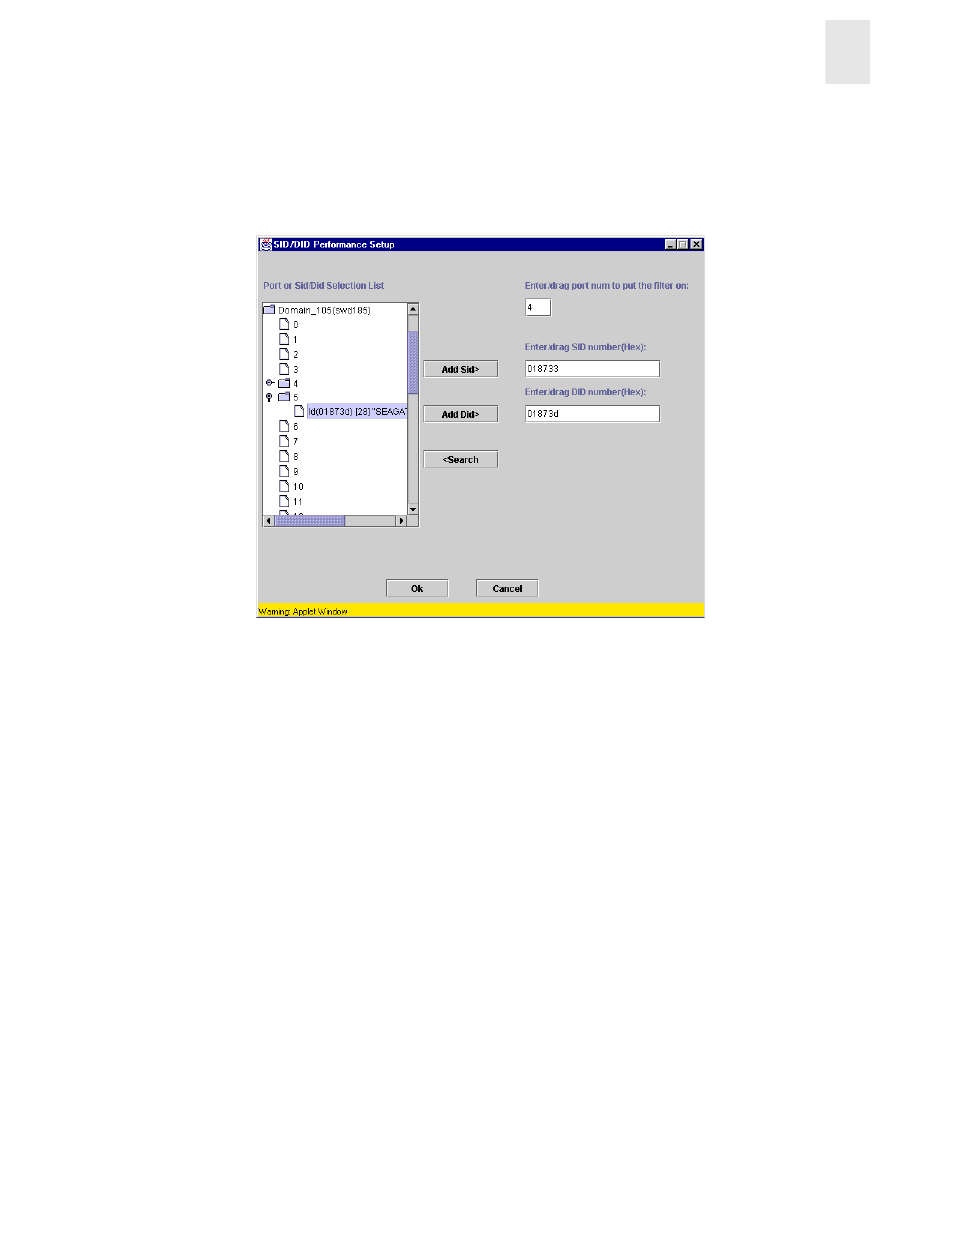
When you select the SID/DID Performance Graph, you will be prompted with a data entry window
where you will chose the SID and DID to be charted. Figure 4-36 is an example of the data entry
window that you will see when you choose to create a SID/DID Performance Graph.
Figure 4-36 SID/DID Performance Setup Data Entry Window
To choose the port and SID/DID that you want to graph:
1.
Double-click on a folder in the Port Selection List window.
A drop-down list of ports will appear.
2.
Select the port that you want to monitor or change by using one of the following methods:
•
Type the port number in the Enter /Drag Port Numbers window.
•
Drag the port “folder” from the Port Selection window to the Enter/Drag Port Number
window.
3.
Select the port “folder”, or the small icon that appears next to it. A drop-down list of SID/DID
files will appear.
4.
Select the SID/DID numbers that you want to graph by using one of the following methods:
•
Type the SID number in the Enter /drag SID Numbers window. Repeat for the DID
number.
•
Drag the SID “file” from the Port Selection window to the Enter/drag SID Number
window. Repeat for the DID number.
5.
Select OK.
A graph displaying the CRC errors for the chosen port will be displayed.
An example of an SID/DID graph, displaying the traffic between a SID and a DID pair, is shown in
Figure 4-37.